Zorro Trader has a very nice feature that allows us to take a closer look at the effect of the parameters we are trying to optimize on the performance of our algorithmic trading strategy. Sure, the optimize()function can pick an optimal value for us, but it would be nice if we could get some insight into the decision process, and get a better understanding of what makes a robust parameter. The parameter chart for the optimization of our simple moving average formation period is in the picture above. Let’s see how we can generate such a chart, and what we can learn from it!
September, 2022 - Algo Trading Pro
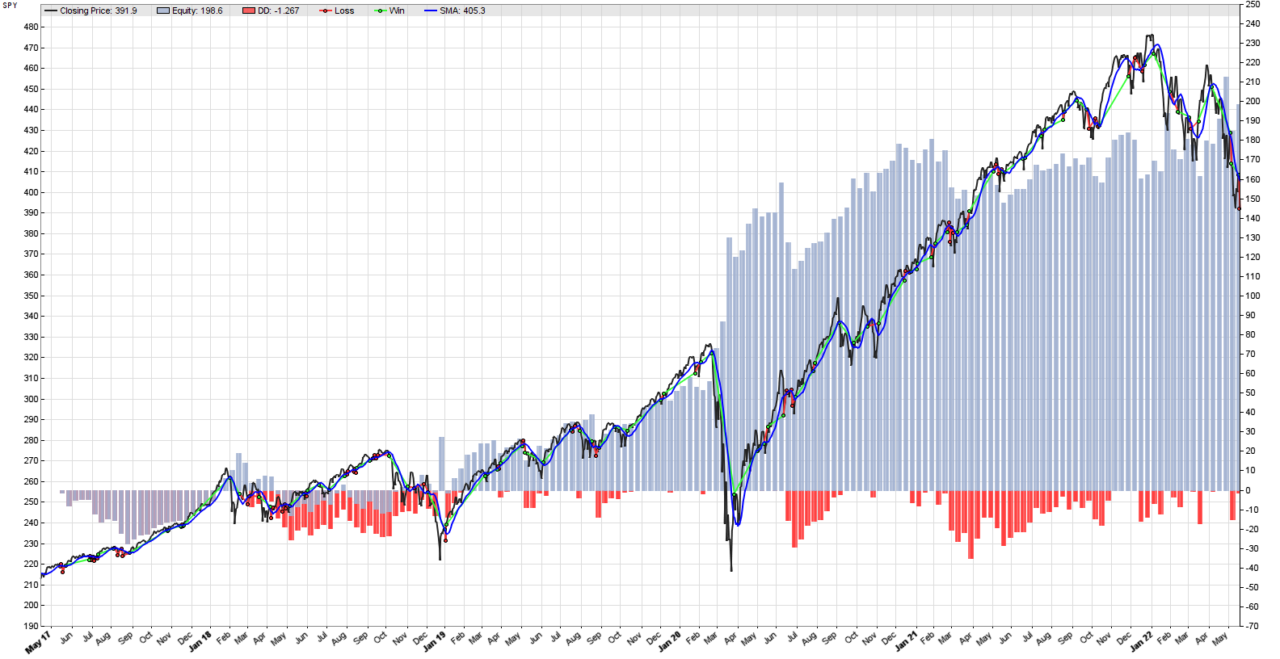
In the previous post we managed to use Zorro Trader’s optimize() function in order to find the most robust value for the single parameter of our very simple trend following algorithmic trading strategy. Zorro Trader saved the optimal value for us in a .par file, and it knows how to retrieve it without user intervention. All we need to do now is hit the Test button, and Zorro Trader will run a back-test using the optimized value of the formation period of our simple moving average. The equity curve is depicted above, and now it looks significantly better!
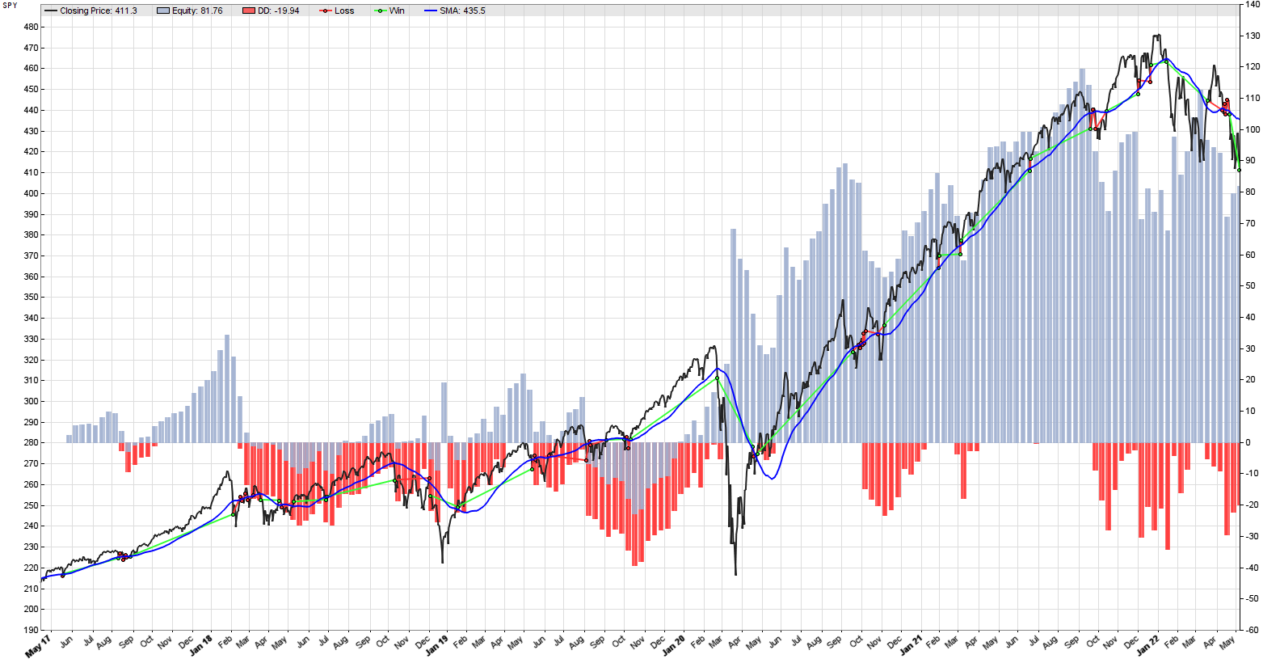
Remember our simplest trend following strategy in Zorro Trader? We were trading the SPY, and we used a moving average of a certain length (50 days) as our trend indicator. When the price crossed above this moving average, we closed any short positions and entered a long position. When the price crossed below the moving average, we closed any long positions, and entered a short position. We made an Annual Return of 3% with a Sharpe Ratio of 0.27, which makes this a poor trading strategy. The equity curve of the strategy is in the picture above, and it does not look too good.


