Zorro Trader has a very nice feature that allows us to take a closer look at the effect of the parameters we are trying to optimize on the performance of our algorithmic trading strategy. Sure, the optimize()function can pick an optimal value for us, but it would be nice if we could get some insight into the decision process, and get a better understanding of what makes a robust parameter. The parameter chart for the optimization of our simple moving average formation period is in the picture above. Let’s see how we can generate such a chart, and what we can learn from it!
The Zorro Trader Parameter Chart
In order to generate the image above, there is only one little change we need to make to the code of our strategy. We already added the PARAMETERS flag to the code of our algorithmic trading strategy, so Zorro Trader knows that we want to optimize one or more parameters. In order to generate the parameter chart, we need to add another flag, named LOGFILE. This can be accomplished in the same line of code where we set the PARAMETERS flag, like this:
set(PARAMETERS + LOGFILE);
Setting the LOGFILE flag determines Zorro Trader to export in various files the logs and statistics of the activities it is performing. In this case, it will save the information pertaining all the trades in the back-tests it performs in order to accomplish the optimization process. For every value of the parameter under optimization, Zorro Trader will perform a back-test of the strategy and will save the pertinent data, as directed by the LOGFILE flag. This data will then be used to generate de parameter chart.
The chart is generates automatically at the end of the training process. Without the LOGFILE flag, when we hit the Train button, all we get is the optimized value of the parameter. When the LOGFILE flag is set, after we hit the Train button, the parameter chart is generated and displayed automatically for us. Nothing else changes, and we can run a back-test using the optimized value of the parameter by hitting the Test button as before. Of course, the performance will be the same. We only added a visualization step to the process.
What Can We Learn From a Parameter Chart?
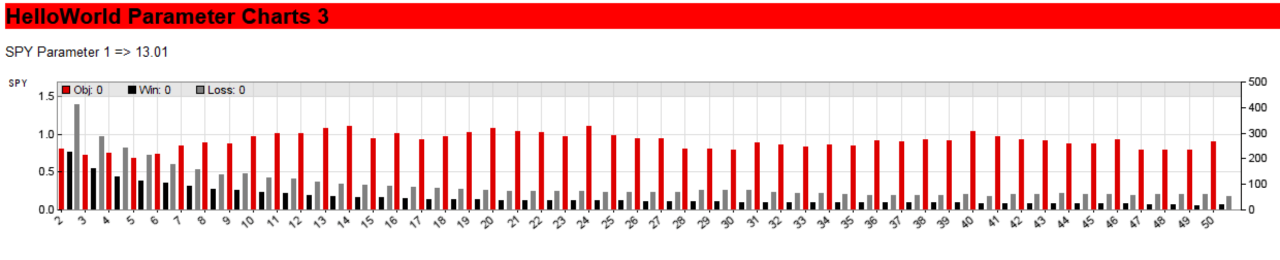
Basically, we can learn how much the optimized parameter influences the performance of our strategy, and if the parameter is robust. We know already that we do not like strategies that depend heavily on particular values of a parameter. The parameter chart can help us to determine more clearly the extent of this dependence. We can also determine if a particular value of a parameter has “good neighbors” or keeps “bad company”.
Each value of the parameter we optimized is associated with three bars on the parameter chart. In this case, the red bar is the profit factor, which is the measure of the strategy’s performance (and this can be changed, of course). The black bar indicates the winning trades, and the gray bar the losing trades. We can read the value of the performance (red bar) on the left vertical axis of the chart, and the number of winning and losing trades on the right vertical axis. This gives us a general idea of the impact of each value of the parameter under optimization on the performance of the strategy.
Choosing Robust Parameters in Zorro Trader
Let us focus on the value 13, which was chosen by Zorro Trader as optimal. Clearly, the performance of the strategy is less than if the value 24 were chosen (red bar is higher for 24 than 13). However, take a closer look at the “neighbors” of 13, which are 12 and 14. Both values have a profit factor higher than 1, which means both values for the parameter are profitable. So, in theory, even the market conditions change a little in the future, the strategy would still be profitable. In other words, the value 13 has “good neighbors”, in the sense that both 12 and 14 are profitable values for the moving average formation period (and so is 11).
Not the same thing can be said about the value 24. Although it may be the most profitable value on this chart, choosing 23 or 25 as the formation period for the simple moving average would loose us money. The red bar, the profit factor, is less than 1 for both values. Even a small change in the market conditions would turn a profitable strategy into an unprofitable one. So although the value 24 is more profitable, it has “bad neighbors”. We can say that the value 13 is more robust than the value 24, because it is less sensitive to small changes in market conditions. And this is why Zorro Trader chose the value 13 as optimal.
Conclusion
Ideally, we would like our algorithmic trading strategies to have parameters that would generate profit for all possible values of those parameters. We would love to see the red bar always high above 1, and with as little variation between the red bars as possible. Then we could just pick the value with the highest profit factor, and hope for the best. Unfortunately, this is rarely the case in real life. The Zorro Trader parameter chart is helpful in order to determine how far from the ideal situation our strategy parameters really are. “Bad” strategies, with “bad” parameters can be identified rather quickly, just by visual inspection. It is also useful in order to determine, to some extent, how likely it is for the strategy to perform well in the future. The more “good neighbors” a parameter value has, the more likely it is that the strategy will be profitable in the future. And only two good neighbors are not enough to ensure profitability in the future, except maybe for a short period of time. And… only if the market conditions do not change much!
by Algo Mike
Experienced algorithmic and quantitative trading professional.