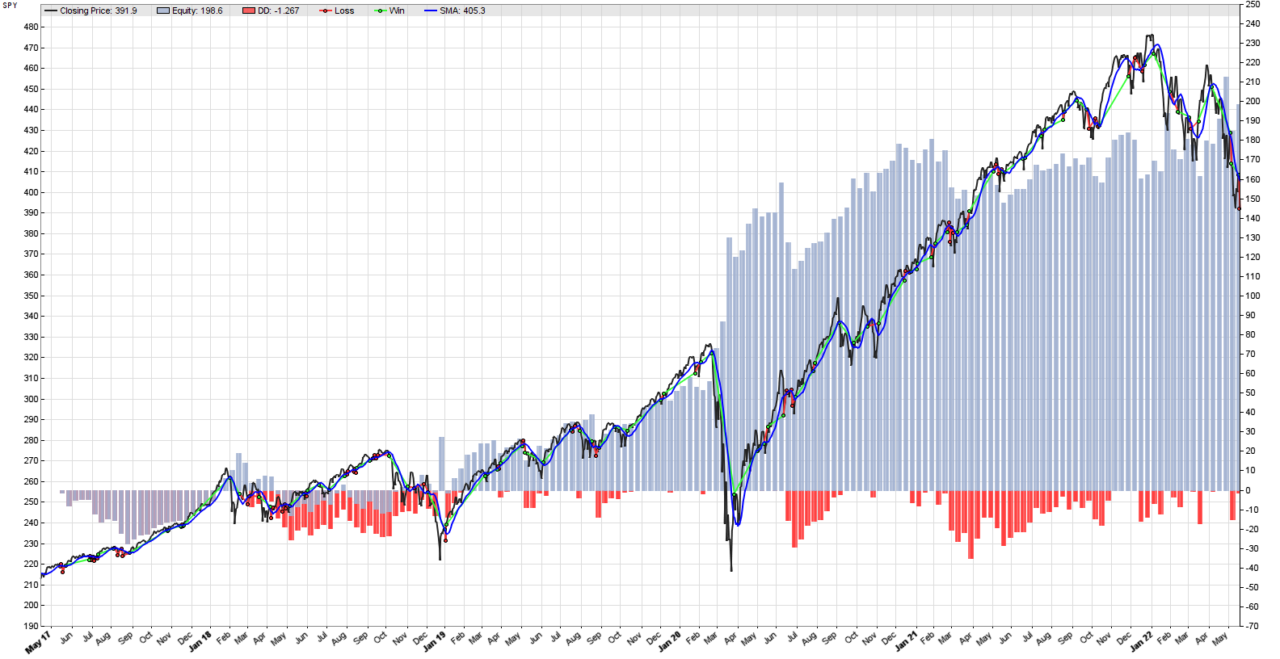
In the previous post we managed to use Zorro Trader’s optimize() function in order to find the most robust value for the single parameter of our very simple trend following algorithmic trading strategy. Zorro Trader saved the optimal value for us in a .par file, and it knows how to retrieve it without user intervention. All we need to do now is hit the Test button, and Zorro Trader will run a back-test using the optimized value of the formation period of our simple moving average. The equity curve is depicted above, and now it looks significantly better!
Performance of the Optimized Simplest Trend Following Strategy in Zorro Trader
Test HelloWorld SPY, Zorro 2.444

Simulated account   AssetsFix
Bar period          24 hours (avg 2087 min)
Total processed     1965 bars
Test period         2017-04-28..2022-05-18 (1273 bars)
Lookback period     80 bars (23 weeks)
Montecarlo cycles   200
Simulation mode     Realistic (slippage 5.0 sec)
Avg bar             360.6 pips range
Spread              10.0 pips (roll 0.00/0.00)
Commission          0.02
Contracts per lot   1.0

Gross win/loss      525$-352$, +17379.4p, lr 254$
Average profit      34.39$/year, 2.87$/month, 0.13$/day
Max drawdown        -36.22$ 20.8% (MAE -52.14$ 30.0%)
Total down time     67% (TAE 92%)
Max down time       44 weeks from Feb 2018
Max open margin     467$
Max open risk       4.79$
Trade volume        47759$ (9450$/year)
Transaction costs   -15.40$ spr, -1.05$ slp, 0$ rol, -3.08$ com
Capital required    495$

Number of trades    154 (31/year)
Percent winning     33.8%
Max win/loss        68.02$ / -16.58$
Avg trade profit    1.13$ 112.9p (+1010.3p / -344.7p)
Avg trade slippage  -0.0068$ -0.7p (+8.1p / -5.1p)
Avg trade bars      8 (+18 / -2)
Max trade bars      49 (14 weeks)
Time in market      99%
Max open trades     1
Max loss streak     7 (uncorrelated 13)

Annual return       7%
Profit factor       1.49 (PRR 1.17)
Sharpe ratio        0.62 (Sortino 0.63)
Kelly criterion     5.11
Annualized StdDev   12.21%
R2 coefficient      0.784
Ulcer index         9.9%
Scholz tax          46 EUR

Year Jan Feb Mar Apr May Jun Jul Aug Sep Oct Nov Dec Total
2017                  -1  -1  -1  -2   1   1   1   1    -2
2018   3   1  -0  -4   0   1   1  -1  -1   3  -1   3    +4
2019   1   2  -2   2   0   1  -1  -1   2   1   2   0    +8
2020   1   7   6   6  -1  -6   2   4   1   4   0   0   +25
2021  -0  -4  -3   4  -2   2   1   1  -1   2   1  -2    -2
2022   2  -1   1   8  -9                                +1

Confidence level     AR   DDMax  Capital
 10%                  7%    32   491$
 20%                  7%    35   494$
 30%                  7%    40   498$
 40%                  7%    43   500$
 50%                  7%    47   503$
 60%                  7%    55   509$
 70%                  7%    60   513$
 80%                  7%    67   519$
 90%                  6%    81   529$
 95%                  6%   100   544$
100%                  6%   153   585$

Portfolio analysis  OptF  ProF  Win/Loss   Wgt%

SPY                 .999  1.49   52/102   100.0
SPY:L               .999  2.05   36/41     99.7
SPY:S               .032  1.00   16/61      0.3
Performance Analysis
This is quite an improvement. Our Annual Return has more than doubled, from 3% to 7%. Our Profit Factor went from 1.39 to 1.49. Our Sharpe Ratio is now 0.62, up from 0.27. In other words, we more than doubled our profits and we are taking on less than half the risk. We did achieve comparable performance (and better) by changing our simplest strategy in other ways, but we did manage to complicate it by doing that, and simple is usually better. This is the power of parameter optimization in Zorro Trader: we can keep things simple, but still make them better!
Conclusion
A word of caution is in order here, though. Please do not go and trade this strategy with real money! At this point, there is no reason to believe that the optimal value Zorro Trader found for us will work in the future as well! Clearly, it didn’t always work in the past either, as the equity curve shows. From May 2017 to February 2019 we were under water. That means a formation period of 13 days for the simple moving average during those two years was clearly sub-optimal. Most likely another value would have worked better, because the market was indeed trending. This warrants future exploration, as not many trader could stomach a draw-down that lasts two years.
Also, please remember our conversation abut over-fitting. One can “memorize” the past by fine-tuning the parameters of a strategy. Even if the strategy has only one parameter, optimizing it foolishly can get us to the same result. And the past does not repeat in the future, so we should avoid overfitting at any cost. Before we get to that topic, though, we should take a closer look at the behavior of the strategy performance for different values of the optimized parameter. Maybe we can learn something from it? Zorro Trader makes it real easy to do that, and we will address that in our next post.
by Algo Mike
Experienced algorithmic and quantitative trading professional.