Zorro Trader - Algo Trading Pro

September 18, 2022
Parameter_Optimization_Space-1280x260.png

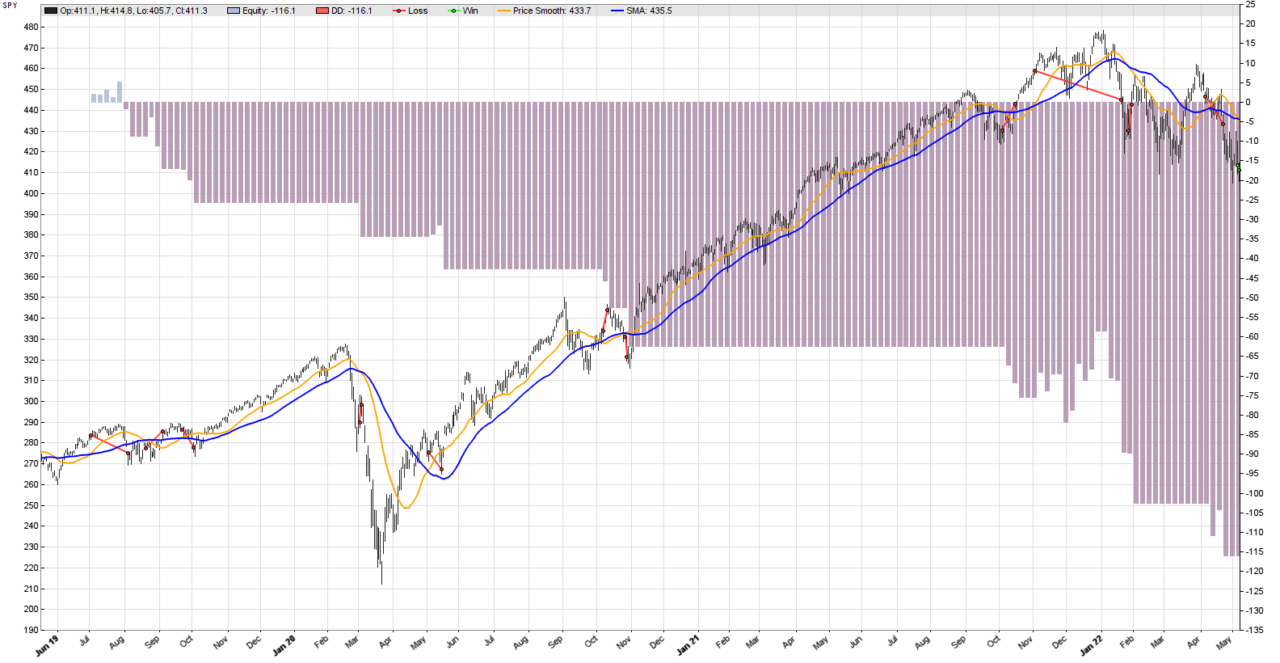
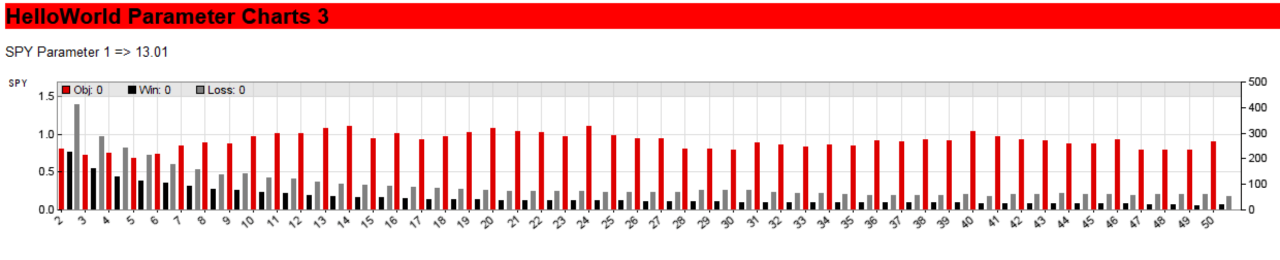
Zorro Trader has a very nice feature that allows us to take a closer look at the effect of the parameters we are trying to optimize on the performance of our algorithmic trading strategy. Sure, the optimize()function can pick an optimal value for us, but it would be nice if we could get some insight into the decision process, and get a better understanding of what makes a robust parameter. The parameter chart for the optimization of our simple moving average formation period is in the picture above. Let’s see how we can generate such a chart, and what we can learn from it!


September 18, 2022
SimpleSMA_SPY_optimized-1280x659.png

In the previous post we managed to use Zorro Trader’s optimize() function in order to find the most robust value for the single parameter of our very simple trend following algorithmic trading strategy. Zorro Trader saved the optimal value for us in a .par file, and it knows how to retrieve it without user intervention. All we need to do now is hit the Test button, and Zorro Trader will run a back-test using the optimized value of the formation period of our simple moving average. The equity curve is depicted above, and now it looks significantly better!


September 18, 2022
Zorro_Trader_Price_SMA_SPY-1280x663.png

Remember our simplest trend following strategy in Zorro Trader? We were trading the SPY, and we used a moving average of a certain length (50 days) as our trend indicator. When the price crossed above this moving average, we closed any short positions and entered a long position. When the price crossed below the moving average, we closed any long positions, and entered a short position. We made an Annual Return of 3% with a Sharpe Ratio of 0.27, which makes this a poor trading strategy. The equity curve of the strategy is in the picture above, and it does not look too good.


May 18, 2022
Zorro_Trader_ADX_RSI_EURUSD-1280x667.png

We managed to produce a terrific Zorro Trader back-test of our ADX and RSI trend following strategy on the mean-reverting EUR/USD pair. The equity curve is above, and the trades look beautiful. But the market does not rewards us for beautiful equity curves or impressive back-tests. It only rewards us for creating robust systematic trading strategies that work equally well in the future as they did in the past. And one important condition for that to happen is what we stated before: a strategy should not depend heavily on the values we set for its parameters.


May 18, 2022
Zorro_Trader_Moving_Averages_EURUSD-1280x663.png

Trend following in mean reverting assets is notoriously difficult. We ran a back-test of our simple two moving averages trend following strategy (25 days and 50 days) on the EUR/USD FOREX pair in Zorro Trader. The result is in the image above. The equity curve looks terrible, and the strategy is on the wrong side of most of the trends. Time series that exhibit some degree of mean reversion do not lend themselves easily to moving averages trading strategies. But we know that there are some profitable trends in the price curve. We see them, but how can we trade them?


May 17, 2022
Zorro_Trader_MeanReversion_EURUSD_Short_RSI-1280x665.png

Every algorithmic trading strategy has some parameters. The parameters need to be initialized at the beginning, and maybe changed later. The values we choose for these parameters (arbitrarily or by computation) can have a very large effect on the performance of the algorithmic trading strategy. In this post, we will explore this effect on our simple mean reversion strategy on the EUR/USD pair in Zorro Trader.


May 16, 2022
Zorro_Trader_MeanReversion_EURUSD-1280x665.png

Remember the equity curve of our RSI mean reversion systematic trading strategy from the previous post (displayed above)? We were trading the EUR/USD Forex pair, and used a RSI formation period of 10 days. As you know, any technical indicator that needs a formation period will lag. The longer the formation period, the longer the lag. And we know that sometimes this lag can hurt our results. How about we analyze what changes when we change the RSI formation period in Zorro Trader? Maybe we can learn something useful from that.


May 16, 2022
Zorro_Trader_MeanReversion_SPY_MaxLong_MaxShort-1280x665.png

Some assets (like commodities and stocks) tend to trend more than others (like FOREX pairs). In order to investigate the performance of our simplest RSI mean reversion strategy, we will run a Zorro Trader back-test on the EUR/USD pairs. This pair is supposed to mean revert much more than the SPY exchange traded fund. The result of trading the strategy on the SPY is in the back-test equity curve picture above. Not so good during trends, but pretty good in trading ranges.


May 15, 2022
Zorro_Trader_MeanReversion_SPY-1280x665.png

Mean reversion is the property of a time series to drift away from some mean (like a moving average), but then return to it. In a way, it is the opposite of a trend, which tends to continue for a while. In a sideways market, prices go up and down randomly, but their mean stays pretty much the same. Mean reverting behavior can be observed during some trends as well, but then the mean (moving average) is drifting up or down. Arguably, the simplest way to trade mean reverting markets in Zorro Trader is to use the RSI indicator. The result for SPY is in the picture above.


May 14, 2022
Zorro_Trader_SPY_Second_Period-1280x663.png

This Zorro Trader Results picture shows clearly that our simple systematic trading strategy stops working in June 2019. All the trades we entered during or after that month ended up loosing money. However, a closer look reveals that the potential for profit was there. If we examine the moving averages crossover signals, it is very easy to see that the signals do capture the trends really well. The culprit jumps to the eye immediately: it is the stop loss.