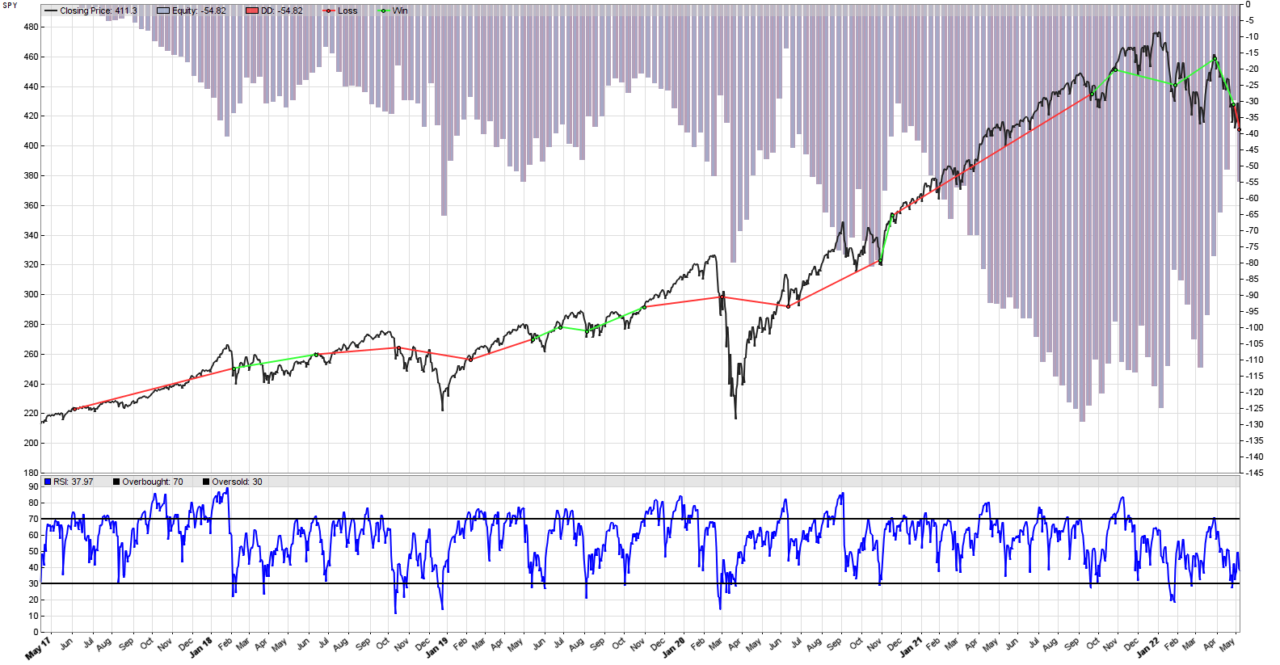
Some assets (like commodities and stocks) tend to trend more than others (like FOREX pairs). In order to investigate the performance of our simplest RSI mean reversion strategy, we will run a Zorro Trader back-test on the EUR/USD pairs. This pair is supposed to mean revert much more than the SPY exchange traded fund. The result of trading the strategy on the SPY is in the back-test equity curve picture above. Not so good during trends, but pretty good in trading ranges.
The rationale of choosing the EUR/USD pair is an economic principle. Both the European Union and the United States have developed economies. The economic performance of both economies is reflected in the exchange rate of their currencies. The ratio of the two currencies does fluctuate, as it is influenced by a myriad of small micro-economic events. However, unless nothing major disrupts this “equilibrium”, the pair should exhibit mean reversion properties. Over time, the SPY always goes up. But there is no reason for the EUR/USD pair to do the same, because both economies are usually doing well.
Full code of the mean reversion strategy in Zorro Trader
function run()
{
	BarPeriod = 1440;
	MaxLong = MaxShort = 1;

	var overbought_level = 70;
	var oversold_level = 30;

	vars price = series(priceClose());
	vars rsi = series(RSI(price, 10));

	if(crossOver(rsi, oversold_level)) enterLong();
	if(crossUnder(rsi, overbought_level)) enterShort();

	plot("RSI", rsi, LINE|NEW, BLUE);
	plot("Overbought", overbought_level, LINE, BLACK);
	plot("Oversold", oversold_level, LINE, BLACK);
}
Please note the placement of the line of code where we initialize the MaxLong and MaxShort internal variables. It comes right after the BarPeriod internal variable. You should always keep your Zorro Trader internal variable initializations together, at the beginning of your code. This makes them easier to find and change. The program may work even if you scatter some of them around your code, but even if it works, it is bad programming practice. Please do not do it!
Back-testing in Zorro Trader: the simplest RSI mean reversion on the EUR/USD pair
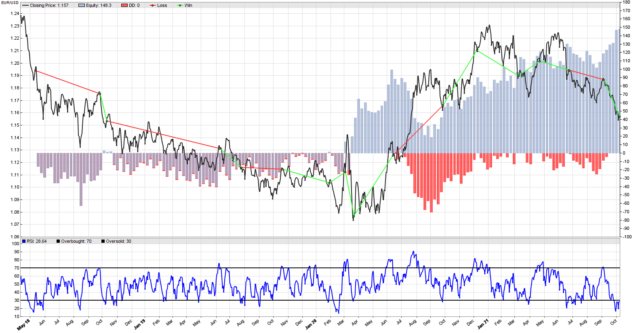
Well, the equity curve does not look too good. Obviously, we loose money during the first period of the back-test, when the pair trended more than it mean reverted. However, when there was mean reversion, we did make some nice profits. Please note that we also got lucky a couple of times, during the first (downtrend) period. Can you explain how that happened? Hint: look at the RSI plot.
Performance analysis of the RSI mean reversion strategy on EUR/USD
Test MeanReversion EUR/USD, Zorro 2.444

Simulated account   AssetsFix
Bar period          24 hours (avg 2027 min)
Total processed     1377 bars
Test period         2018-04-25..2021-10-08 (896 bars)
Lookback period     80 bars (22 weeks)
Montecarlo cycles   200
Simulation mode     Realistic (slippage 5.0 sec)
Avg bar             71.3 pips range
Spread              1.5 pips (roll -0.10/-0.11)
Contracts per lot   1000.0

Gross win/loss      246$-98.16$, +1481.3p, lr 173$
Average profit      42.87$/year, 3.57$/month, 0.16$/day
Max drawdown        -70.47$ 47.6% (MAE -82.01$ 55.4%)
Total down time     80% (TAE 94%)
Max down time       44 weeks from Oct 2018
Max open margin     12.10$
Max open risk       12.25$
Trade volume        18450$ (5340$/year)
Transaction costs   -2.40$ spr, -0.70$ slp, -12.73$ rol
Capital required    77.76$

Number of trades    16 (5/year)
Percent winning     68.8%
Max win/loss        47.77$ / -41.96$
Avg trade profit    9.26$ 92.6p (+223.9p / -196.3p)
Avg trade slippage  -0.0438$ -0.4p (+0.5p / -2.5p)
Avg trade bars      55 (+38 / -92)
Max trade bars      171 (48 weeks)
Time in market      99%
Max open trades     1
Max loss streak     1 (uncorrelated 2)

Annual return       55%
Profit factor       2.51 (PRR 1.21)
Sharpe ratio        0.62 (Sortino 0.68)
Kelly criterion     0.70
Annualized StdDev   88.66%
R2 coefficient      0.105
Ulcer index         19.5%
Scholz tax          39 EUR

Year Jan Feb Mar Apr May Jun Jul Aug Sep Oct Nov Dec Total
2018                 -33  -2   3 -13  35 -15  -0  12   -13
2019   7 -15 -19  -3  -7  11  24 -19 -11  30  16 -26   -13
2020  26 -12  94  -6  20  17 -74 -16  46  -9  41  -5  +122
2021  14   0   9  34 -26  24   1  -9  44   2           +93

Confidence level     AR   DDMax  Capital
 10%                 58%    66   73.51$
 20%                 50%    79   85.70$
 30%                 46%    88   93.77$
 40%                 41%    98   103$
 50%                 38%   107   112$
 60%                 34%   121   124$
 70%                 31%   135   138$
 80%                 27%   157   159$
 90%                 23%   191   190$
 95%                 19%   227   224$
100%                 14%   322   312$

Portfolio analysis  OptF  ProF  Win/Loss   Wgt%

EUR/USD             .158  2.51   11/5     100.0
EUR/USD:L           .144  1.97    4/4      36.7
EUR/USD:S           .162  3.24    7/1      63.3
Conclusion
Wow! Given the aspect of the equity curve, this is a surprisingly good performance report. Half of the time we were under water, but then we managed to get an Annual Return of 55% with a Sharpe Ratio of 0.62. This is not bad at all – for such a simple strategy. If only we could do something about that first period when we lost money, this could be a solid money making systematic trading strategy! Can we? And how? Find some ideas, and learn more about Zorro Trader in our tutorials and Zorro Trader video courses in the members area.
by Algo Mike
Experienced algorithmic and quantitative trading professional.