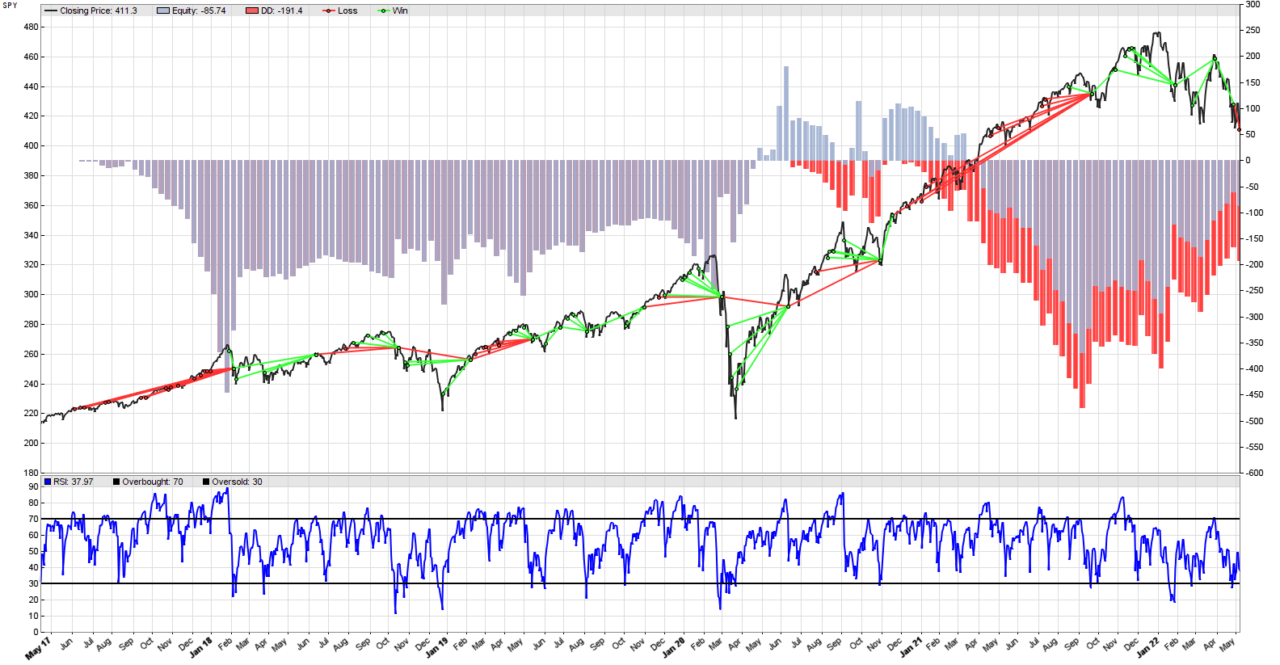
Mean reversion is the property of a time series to drift away from some mean (like a moving average), but then return to it. In a way, it is the opposite of a trend, which tends to continue for a while. In a sideways market, prices go up and down randomly, but their mean stays pretty much the same. Mean reverting behavior can be observed during some trends as well, but then the mean (moving average) is drifting up or down. Arguably, the simplest way to trade mean reverting markets in Zorro Trader is to use the RSI indicator. The result for SPY is in the picture above.
Simplest mean reversion in Zorro Trader
Most traders are familiar with the Relative Strength Index indicator. It requires a formation period (length in bars) and two levels: overbought and oversold. The indicator fluctuates between 0 and 100. When it crosses the overbought level, the price of the asset is considered high comparative to the prices during the formation period, and vice-versa. If the market is mean reverting, an overbought asset’s price should go down. If it is oversold, the price should go up. That is not true, of course, if the market conditions change, and a trend starts to develop.
In plain English, the simplest systematic RSI mean reversion strategy is:
- Calculate the RSI indicator for a certain formation period (we arbitrarily choose 10 days).
- Choose two values for the overbought and oversold levels (we choose 70 and 30).
- If the RSI indicator crosses under the overbought level, close any long positions and go short.
- If the RSI indicator crosses over the oversold level, close any short positions and go long.
The rationale of this strategy is simple. Assuming the market is in a mean reverting trading range and will remain so, buy when the price is low, and sell when the price is high. And the RSI indicator is generating the trading signals for us. Very simple, indeed!
The Lite-C code for the strategy in Zorro Trader
function run()
{
	BarPeriod = 1440;

	var overbought_level = 70;
	var oversold_level = 30;

	vars price = series(priceClose());
	vars rsi = series(RSI(price, 10));

	if(crossOver(rsi, oversold_level)) enterLong();
	if(crossUnder(rsi, overbought_level)) enterShort();

	plot("RSI", rsi, LINE|NEW, BLUE);
	plot("Overbought", overbought_level, LINE, BLACK);
	plot("Oversold", oversold_level, LINE, BLACK);
}
We have to define and initialize two variables of type var to store the two price levels we want to check in the trading logic (and also plot later). You should always choose suggestive names for your variables, so we will not call them simply overbought and oversold, but overbought_level and oversold_level. Using an underscore as a separator makes the names of the variables easier to read. We are also introducing a new argument for the plot() function. Please note that we added |NEW to the LINE type of the first plot function (which plots the RSI indicator).
The new plot type is now LINE|NEW. It will still plot the RSI as a line, but Zorro Trader will display this plot in a new window, under the equity curve. We do not want the RSI displayed in the equity curve window to improve visibility. Please note that all the other plot() function calls will be displayed in this new window as well. The two other plot function calls will display the overbought and oversold levels.
Trading logic does not work as expected
A closer examination of the resulting picture (at the top of this post) reveals that our trading logic does not work as expected. Zorro Trader is entering into multiple long and short positions, not just one, as it was the case with the trend following strategy. This is not necessarily bad, but it is not what we wanted. It happens because sometimes the RSI wiggles around the overbought or oversold levels before returning to the mean. Zorro Trader buys or sells each time. This can be a strategy in its own respect, but again, it is not what we wanted.
So, how do we fix this? Well, it is time to introduce two more internal Zorro Trader variables: MaxLong and MaxShort. They do not need a type, as Zorro Trader knows them already. They define the maximum number of long trades (or short trades) we want to be in at a time. To follow our initial trading strategy, we need to set both these variables to 1, like this:
MaxLong = MaxShort = 1;
Initializing these two variables to 1 tells Zorro Trader to “disregard” any buy (or sell) RSI signals of the same type that happen in succession after we enter a long (or short) position. If the RSI crosses above the oversold level and we BUY, no matter how many times after that it wiggles and crosses above it again, do not buy again. This will prevent us from being in multiple positions of the same type at the same time.
A back-test with MaxLong and MaxShort in Zorro Trader
Now this is a pretty cool result, although the equity curve looks terrible! Please look at the three successive winning trades (long-short-long) around the middle of the price curve. This is a very clear example of successful mean reversion trading. The SPY was in a trading range, and there was no trend. But the price fluctuations were large enough for us to capture some profits. You can see the same effect at the right side of the price curve (four winning trades in a larger mean reverting trading range).
Please also note that when there was a trend (big or small), we were almost always loosing money. That is because we are using the RSI here to do mean reversion trading. When the market trends, using the RSI in this manner will almost always generate losses. Each market regime needs its own systematic trading strategy in order to be profitable!
Performance analysis of the mean reversion strategy in Zorro Trader
Test MeanReversion SPY, Zorro 2.444

Simulated account   AssetsFix
Bar period          24 hours (avg 2087 min)
Total processed     1953 bars
Test period         2017-04-28..2022-05-06 (1265 bars)
Lookback period     80 bars (23 weeks)
Simulation mode     Realistic (slippage 5.0 sec)
Avg bar             357.1 pips range
Spread              10.0 pips (roll 0.00/0.00)
Commission          0.02
Contracts per lot   1.0

Gross win/loss      140$-198$, -5754.3p, lr -97.16$
Average profit      -11.46$/year, -0.95$/month, -0.0441$/day
Max drawdown        -129$ -224.4% (MAE -130$ -226.6%)
Total down time     97% (TAE 97%)
Max down time       303 weeks from Jul 2017
Max open margin     459$
Max open risk       4.71$
Trade volume        5847$ (1165$/year)
Transaction costs   -1.80$ spr, -0.52$ slp, 0$ rol, -0.36$ com
Capital required    559$

Number of trades    18 (4/year)
Percent winning     50.0%
Max win/loss        30.87$ / -81.98$
Avg trade profit    -3.20$ -319.7p (+1559.9p / -2199.2p)
Avg trade slippage  -0.0290$ -2.9p (+4.8p / -10.6p)
Avg trade bars      68 (+41 / -96)
Max trade bars      212 (61 weeks)
Time in market      98%
Max open trades     1
Max loss streak     3 (uncorrelated 5)

Annual return       -2%
Profit factor       0.71 (PRR 0.35)
Sharpe ratio        -0.18 (Sortino -0.19)
Kelly criterion     -1.70
Annualized StdDev   10.71%
R2 coefficient      0.205
Ulcer index         0.0%

Year Jan Feb Mar Apr May Jun Jul Aug Sep Oct Nov Dec Total
2017                       0  -1  -0  -1  -1  -1  -1    -5
2018  -3   3  -1   0   1   2  -2  -2  -0   0   1  -4    -4
2019   3  -1  -1  -2   0   2  -1   2   1   1  -2  -2    +2
2020   0   4 -11   6   2  -2  -3  -4   2   0   6  -2    -2
2021   1  -2  -3  -4  -0  -2  -2  -2   1   3   1  -4   -13
2022   7  -2   5   1  -0                               +12

Portfolio analysis  OptF  ProF  Win/Loss   Wgt%

SPY                 .000  0.71    9/9     100.0
SPY:L               .999  3.08    6/3     -113.5
SPY:S               .000  0.26    3/6     213.5
Conclusion
Mean reversion trading works nicely when the market is… mean reverting. The terrible results of our strategy on the SPY are happening because the SPY seems to spend more time trending than mean reverting. In a further post we will investigate how this strategy works on an asset that is known to mean revert more than it trends, and this will be the topic of our next post. Meanwhile, learn more about Zorro Trader in our members area.
by Algo Mike
Experienced algorithmic and quantitative trading professional.