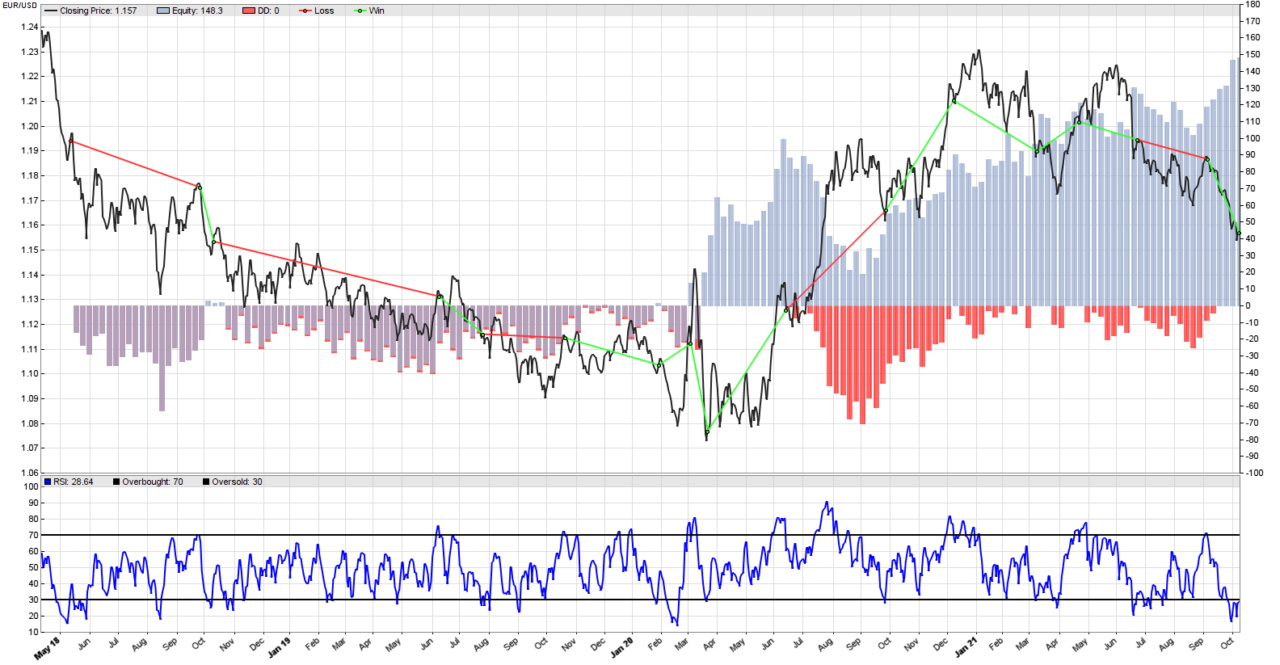
Remember the equity curve of our RSI mean reversion systematic trading strategy from the previous post (displayed above)? We were trading the EUR/USD Forex pair, and used a RSI formation period of 10 days. As you know, any technical indicator that needs a formation period will lag. The longer the formation period, the longer the lag. And we know that sometimes this lag can hurt our results. How about we analyze what changes when we change the RSI formation period in Zorro Trader? Maybe we can learn something useful from that.
Usually, when the value of some parameter may change in the code of our strategy, we use a variable to store that value. This way, we don’t need to keep track of all the places where we used that value in the code. It is good programming practice, and we will follow it here. In the same manner in which we used two variables to store the threshold values for the overbought and oversold levels, we will introduce now a new variable for the RSI formation period. Let’s call it rsi_period and this time let’s initialize it to 4 days. The full code of the strategy is below.
Full code of the Zorro Trader mean reversion strategy with a shorter RSI
function run()
{
	BarPeriod = 1440;
	MaxLong = MaxShort = 1;

	var overbought_level = 70;
	var oversold_level = 30;
	var rsi_period = 4;

	vars price = series(priceClose());
	vars rsi = series(RSI(price, rsi_period));

	if(crossOver(rsi, oversold_level)) enterLong();
	if(crossUnder(rsi, overbought_level)) enterShort();

	plot("RSI", rsi, LINE|NEW, BLUE);
	plot("Overbought", overbought_level, LINE, BLACK);
	plot("Oversold", oversold_level, LINE, BLACK);
}
Of course, we replaced the old value 10 of the RSI formation period in the RSI() function call with the variable name, rsi_period. From now on, whenever we want to change the RSI formation period, we don’t need to search for the RSI() function call throughout the code. Please note that we added and grouped our own variables after the Zorro Trader internal variables, and before the trading logic. It is good programming practice as it makes the code more readable. Please do the same!
Zorro Trader back-test: the shorter RSI mean reversion on the EUR/USD pair
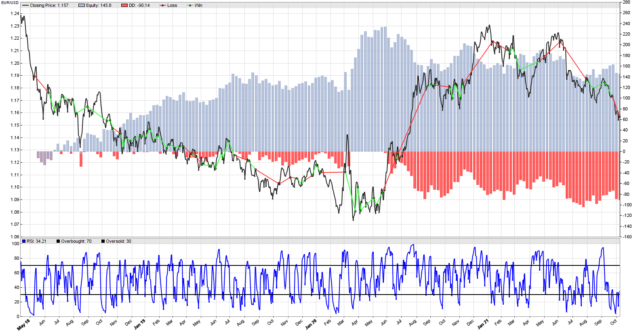
The equity curve looks better with a shorter RSI formation period. As you can clearly see by comparing this image to the one at the beginning of the post, the long period of loses at the beginning of the back-test is now gone. There are also way more trades, but most of them are winning. And we can see that even during trending but “wiggly” periods, we still have winning trades. As long as the price fluctuates enough, our strategy captures some profits even during the gentler trends (not during the steep trends, though). Now let’s examine the performance of our strategy.
Performance analysis of the mean reversion strategy with a shorter RSI
Test MeanReversion EUR/USD, Zorro 2.444

Simulated account   AssetsFix
Bar period          24 hours (avg 2027 min)
Total processed     1377 bars
Test period         2018-04-25..2021-10-08 (896 bars)
Lookback period     80 bars (22 weeks)
Montecarlo cycles   200
Simulation mode     Realistic (slippage 5.0 sec)
Avg bar             71.3 pips range
Spread              1.5 pips (roll -0.10/-0.11)
Contracts per lot   1000.0

Gross win/loss      400$-254$, +1459.9p, lr 172$
Average profit      42.25$/year, 3.52$/month, 0.16$/day
Max drawdown        -105$ 71.6% (MAE -110$ 75.4%)
Total down time     75% (TAE 90%)
Max down time       85 weeks from May 2020
Max open margin     12.18$
Max open risk       12.32$
Trade volume        85929$ (24870$/year)
Transaction costs   -11.25$ spr, -1.99$ slp, -12.87$ rol
Capital required    110$

Number of trades    75 (22/year)
Percent winning     73.3%
Max win/loss        31.27$ / -54.69$
Avg trade profit    1.95$ 19.5p (+72.8p / -127.2p)
Avg trade slippage  -0.0265$ -0.3p (+0.6p / -2.7p)
Avg trade bars      11 (+8 / -21)
Max trade bars      45 (12 weeks)
Time in market      99%
Max open trades     1
Max loss streak     3 (uncorrelated 3)

Annual return       39%
Profit factor       1.57 (PRR 1.11)
Sharpe ratio        0.61 (Sortino 0.64)
Kelly criterion     0.97
Annualized StdDev   62.88%
R2 coefficient      0.000
Ulcer index         20.7%
Scholz tax          39 EUR

Year Jan Feb Mar Apr May Jun Jul Aug Sep Oct Nov Dec Total
2018                 -19  24   7  18  -2   0  25   6   +61
2019  14  15  -4   1   3  27  -1  -1  -8  -1   9  10   +67
2020  -3  -9  60  30  -5  -4 -53  14 -18  39  -9 -24   +18
2021   3   2  -2  24 -18 -25   0   6  -0  -1           -12

Confidence level     AR   DDMax  Capital
 10%                 75%    47   56.22$
 20%                 67%    55   63.25$
 30%                 61%    62   69.80$
 40%                 57%    67   74.20$
 50%                 53%    73   80.12$
 60%                 49%    80   86.28$
 70%                 44%    89   95.19$
 80%                 38%   106   111$
 90%                 32%   128   131$
 95%                 25%   169   170$
100%                 15%   286   279$

Portfolio analysis  OptF  ProF  Win/Loss   Wgt%

EUR/USD             .107  1.57   55/20    100.0
EUR/USD:L           .156  1.51   25/13     38.7
EUR/USD:S           .093  1.62   30/7      61.3
What did we learn from this?
Well, we learned something really important. 73% of our trades are winning, but our average win per trade is less than $2.We win often, but… only a little! And on the less frequent occasions when we loose (27% of the trades), we loose big! The maximum loss was about $55 on one trade.
Remember the problem that was plaguing the trend following strategies we looked at before? With trend following strategies, we always have a few big winning trades, and a lot of small losing trades. We called that effect “death by a thousand cuts” because if the winnings don’t offset the losses, we end up burning all our capital.
By changing the formation period of the RSI to a smaller value, we were able to discover a similar effect in our mean reversion strategy. Similar, but… the other way around! With mean reversion strategies, we count on a lot of small wins, and fear a few big losses during quick and strong market moves (steep trends). Traders call this type of strategy “picking up pennies in front of a steamroller”. You can pick up many pennies, and they can add up, but when the steamroller crushes your trading account, things will get ugly…
Conclusion
By shortening the RSI formation period, we decreased our Annual Return to 39% and our Sharpe Ratio to 0.61. However, the equity curve looks better, and we were able to identify an important effect that plagues most mean reversion strategies. Which was, by the way, the real point of this post. Mean reversion strategies make a lot of small wins, but a few big losses.
When a steep fast trend occurs in either direction (the steamroller!), we are on the right or wrong side of the market mostly because of luck, not the RSI technical indicator. And luck is not the tool we want to use in our algorithmic trading strategies! Learn more from our Zorro Trader tutorials and video courses in the members area.
by Algo Mike
Experienced algorithmic and quantitative trading professional.