Every algorithmic trading strategy has some parameters. The parameters need to be initialized at the beginning, and maybe changed later. The values we choose for these parameters (arbitrarily or by computation) can have a very large effect on the performance of the algorithmic trading strategy. In this post, we will explore this effect on our simple mean reversion strategy on the EUR/USD pair in Zorro Trader.
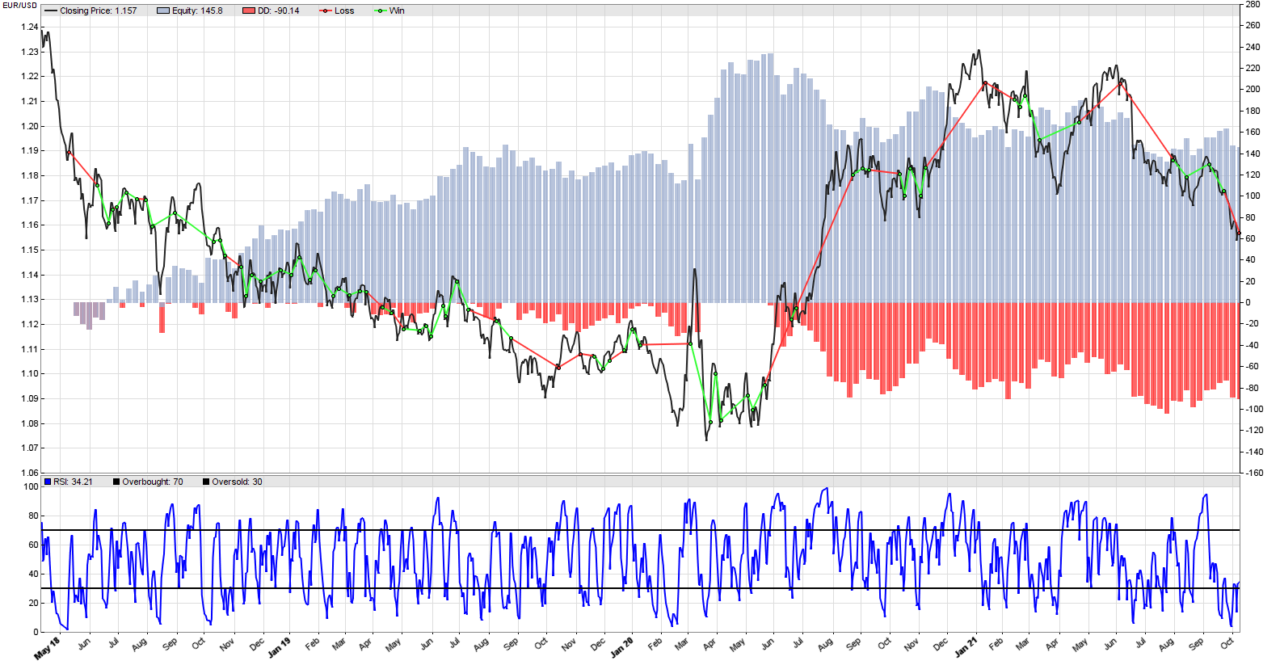
Our systematic RSI mean reversion trading strategy has three parameters. There are two levels, one for overbought and one for oversold, and a RSI formation period. When we initially set their values, we chose 70 and 30 for the levels because these are very popular values among traders. Two other popular levels are 80 for overbought, and 20 for oversold. The initial choice of a 10 days formation period, and later a 4 days formation period were completely arbitrary. The picture above is for the 4 days formation period.
We already know that a 10 days formation period is more profitable, but has a terrible equity curve. The 4 days formation period is less profitable, but has a more reasonable equity curve. Changing the formation period of the RSI indicator did not have a dramatic effect on our strategy. It did change its performance, but in a rather reasonable way. The questions we are trying to answer now are important. How much does the strategy depend on its parameters? Do always small changes have small effects, or the opposite is true? Are there values or combinations that completely break the strategy? Were we just lucky and stumbled upon some combination of parameters that works, or do all combinations work?
The perfect Zorro Trader systematic trading strategy
Ideally, an algorithmic trading strategy should work its magic without any parameters. Zorro Trader should be able to just print money without any input from us. Any “internal” parameters it should need, Zorro Trader should be able to calculate auto-magically. Alas, we live in a far from ideal world, in which we do need to deal with many parameters in our algorithmic trading strategies. The rule of thumb is: the less parameters, the better. And the golden rule is: the less the performance depends on the parameters, the better.
The astute reader will now ask, of course, why? Well, the answer to this question is complex, and beyond the scope of this post. But in one word, our nemesis here is called overfitting. Given enough parameters (if not enough, just add another technical indicator!) any strategy can perform fantastic in a back-test. However, as the number of parameters grows, the probability of good performance in live trading decreases. And that is because we are basically “memorizing” the past, which is highly unlikely to repeat in the future. You know what they say about past performance…
Changing the overbought and oversold levels to 80 and 20
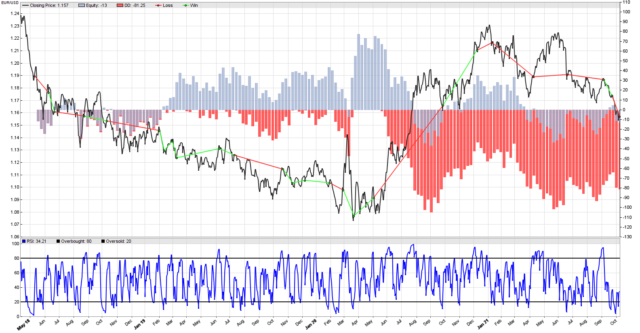
Oops! Now the equity curve looks terrible. We are trading way less, and the biggest trades are loosing money. We can’t even notice the effect we called “picking up pennies in front of a steamroller” anymore. This looks like a completely different strategy! And a quick performance summary confirms it.
Annual return       -3%
Profit factor       0.93 (PRR 0.52)
Sharpe ratio        -0.05 (Sortino -0.06)
Kelly criterion     -0.09
Annualized StdDev   62.70%
R2 coefficient      0.000
Ulcer index         81.8%
Changing the overbought and oversold levels to 60 and 40
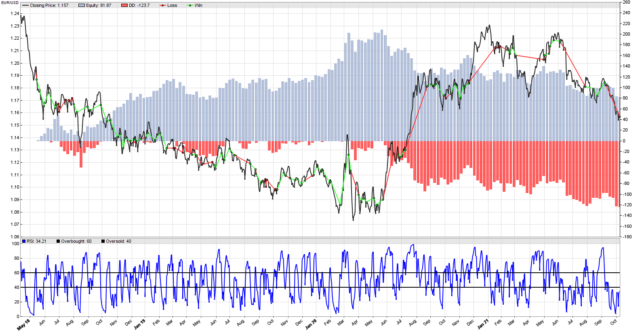
Well, this looks better, and more similar to the 70 and 30 levels. However, the performance is worse.
Annual return       18%
Profit factor       1.24 (PRR 0.95)
Sharpe ratio        0.34 (Sortino 0.34)
Kelly criterion     0.65
Annualized StdDev   52.99%
R2 coefficient      0.000
Ulcer index         29.0%
Changing the formation period of the RSI to 15 days in Zorro Trader
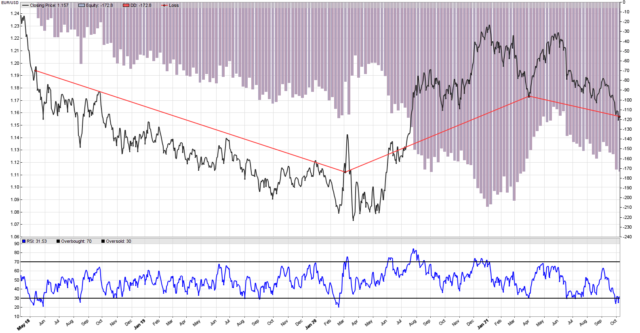
Wow! Now we completely wrecked our strategy. Please note that the overbought level is 70 and the oversold level is 30, like they were when our strategy was profitable. All we changed was the RSI formation period, which is now 15 days. Hm… 4 days, profitable. 10 days, even more profitable. 15 days, complete disaster. And the performance analysis summary confirms it.
Annual return       -24%
Sharpe ratio        0.00 (Sortino 0.00)
Kelly criterion     -2.19
Annualized StdDev   0.00%
R2 coefficient      0.672
Ulcer index         0.0%
Conclusion
Well, it appears our RSI mean reversion strategy depends heavily on the choice of the parameter values. For all the parameters, the range of values that make the strategy profitable is rather narrow. Granted, we did not approach the problem in a rigorous manner, but all we wanted was an intuition, and we did get it. It appears that improving this strategy by playing with the parameters will not work, so we need something else. Learn more about overfitting and explore other improvement ideas for this strategy in our Zorro Trader tutorial and the Zorro Trader video course on overfitting.
by Algo Mike
Experienced algorithmic and quantitative trading professional.