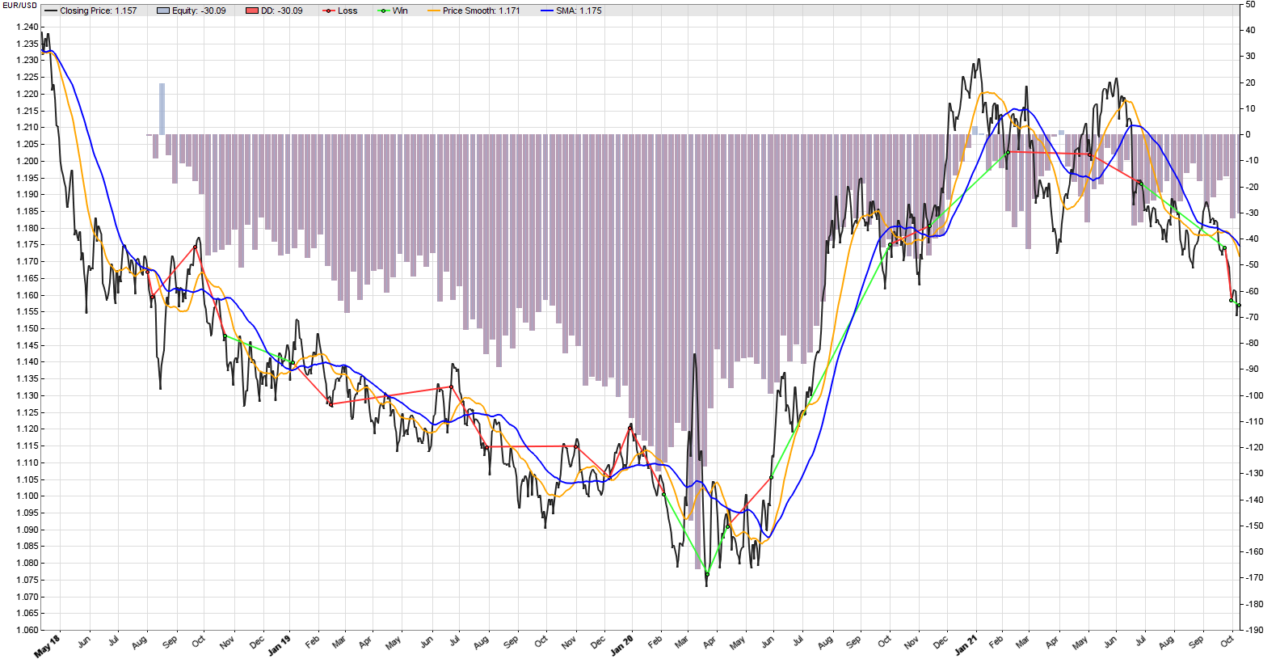
Trend following in mean reverting assets is notoriously difficult. We ran a back-test of our simple two moving averages trend following strategy (25 days and 50 days) on the EUR/USD FOREX pair in Zorro Trader. The result is in the image above. The equity curve looks terrible, and the strategy is on the wrong side of most of the trends. Time series that exhibit some degree of mean reversion do not lend themselves easily to moving averages trading strategies. But we know that there are some profitable trends in the price curve. We see them, but how can we trade them?
Well, we need to think creatively here, and start with mean reversion in mind. Most price curves have periods when they trend, and periods when the price moves sideways. How and when the market regime changes is different for every asset, but in principle, a trend starts when a trading range ends. For assets that exhibit mean reversion properties, the end of a trading range may be a better signal than a moving average crossover.
Zorro Trader has, of course, the technical indicator we need in order to determine if the market is in a trading range or in a trend. The Average Directional Index (ADX) developed by Welles Wilder quantifies in one number the strength of a trend. According to Wilder, there is a trend if ADX is more than 25. And if ADX is less than 20, the market is trendless and moves in a trading range. Cool, so now we can tell if during the formation period of the indicator we are in a trading range or not.
However, the ADX is directionless. It does not tell us the direction of a trend, only its presence and strength (or its absence – which we care about here). So we cannot use ADX to determine the future direction of the market, or to generate trading signals. We need to use a different indicator for that. We will use an indicator we used before for the trading signals, and it worked pretty good on mean reverting series. Welcome back, RSI!
An interesting trend following strategy for EUR/USD in Zorro Trader
The idea of our strategy is simple. We will use the ADX indicator to check if we are in a trading range (ADX as of today is less than 20). If we are in a trading range, we expect a trend to develop. And we think that if the RSI is overbought or oversold, the market will rather mean revert, and if a trend will develop, it will do so in that direction. In other words, we can keep our trading logic just the same, but before entering or exiting trades, we will check if ADX is less than 20. Here is the full code of the strategy.
function run()
{
	BarPeriod = 1440;
	MaxLong = MaxShort = 1;

	var overbought_level = 70;
	var oversold_level = 30;
	var rsi_period = 4;
	var adx_period = 7;
	var adx_level = 20;

	vars price = series(priceClose());
	vars rsi = series(RSI(price, rsi_period));
	vars adx = series(ADX(adx_period));

	if(adx[0] < adx_level) {
		if(crossOver(rsi, oversold_level)) enterLong();
		if(crossUnder(rsi, overbought_level)) enterShort();
	}

	plot("RSI", rsi, LINE|NEW, BLUE);
	plot("Overbought", overbought_level, LINE, BLACK);
	plot("Oversold", oversold_level, LINE, BLACK);
	plot("ADX", adx, LINE|NEW, GREEN);
	plot("ADX Level", adx_level, LINE, BLACK);
}
A few comments about this code are necessary. Please note the new variables adx_period and adx_level. We set the value of 20 days for the ADX level, as according to Wilder the market is trendless then. We set the ADX period to 7 days, as we don’t want a lot of lag, and we want to trader even at the end of shorter trading ranges. We also want to plot the ADX and the “trendless” level, so we added two more plot() function calls at the end of the code.
The if condition before the trading logic deserves special attention. Why didn’t we use a cross-under or cross-over check? Well, because we do not want to trade when the ADX crosses above or below the level, but at any time when it is under the 20 level. And that is why we compare adx[0] with the value 20. adx[0] means, in Lite-C parlance, the most recent value (today) of the adx time series.
Equity curve of the ADX and RSI strategy on EUR/USD
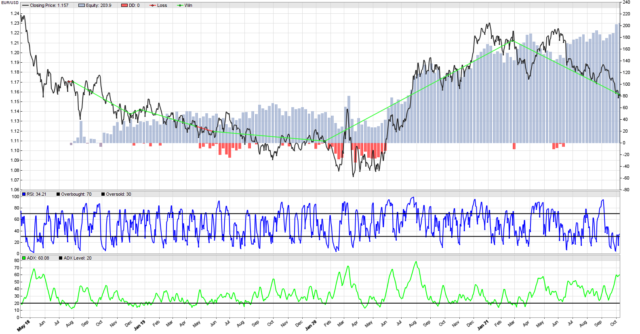
Not bad at all! The equity curve doesn’t look terrible, and we are obviously capturing profits in all trends. We make money when the market moves in either direction, and we got a couple of bad trades during trading ranges. But that is to be expected in any trend following strategy, and the losses seems small. Let us examine the performance strategy in detail.
Performance of the ADX and RSI strategy on EUR/USD in Zorro Trader
Test Trend-ADX-RSI EUR/USD, Zorro 2.444

Simulated account   AssetsFix
Bar period          24 hours (avg 2027 min)
Total processed     1377 bars
Test period         2018-04-25..2021-10-08 (896 bars)
Lookback period     80 bars (22 weeks)
Montecarlo cycles   200
Simulation mode     Realistic (slippage 5.0 sec)
Avg bar             71.3 pips range
Spread              1.5 pips (roll -0.10/-0.11)
Contracts per lot   1000.0

Gross win/loss      210$-6.38$, +2037.4p, lr 191$
Average profit      58.97$/year, 4.91$/month, 0.23$/day
Max drawdown        -37.17$ 18.2% (MAE -69.62$ 34.2%)
Total down time     28% (TAE 85%)
Max down time       12 weeks from Apr 2019
Max open margin     12.12$
Max open risk       12.27$
Trade volume        9186$ (2659$/year)
Transaction costs   -1.20$ spr, 0.14$ slp, -12.32$ rol
Capital required    46.76$

Number of trades    8 (3/year)
Percent winning     75.0%
Max win/loss        98.66$ / -5.83$
Avg trade profit    25.47$ 254.7p (+350.2p / -31.9p)
Avg trade slippage  0.0180$ 0.2p (+0.7p / -1.5p)
Avg trade bars      104 (+133 / -16)
Max trade bars      284 (79 weeks)
Time in market      93%
Max open trades     1
Max loss streak     1 (uncorrelated 1)

Annual return       126%
Profit factor       32.94 (PRR 11.42)
Sharpe ratio        0.90 (Sortino 0.95)
Kelly criterion     0.64
Annualized StdDev   140.55%
R2 coefficient      0.674
Ulcer index         11.4%
Scholz tax          54 EUR

Year Jan Feb Mar Apr May Jun Jul Aug Sep Oct Nov Dec Total
2018                          -1  20  -4  61 -18  15   +73
2019 -12  24  30 -15   6 -50  52  30  17 -53  27 -43   +14
2020  18 -20   6  -9  34  27 122  25 -45 -16  68  55  +264
2021 -24  -6  85 -64 -43  79  -3  13  45   3           +85

Confidence level     AR   DDMax  Capital
 10%                167%    25   35.31$
 20%                153%    28   38.42$
 30%                145%    31   40.76$
 40%                132%    35   44.83$
 50%                125%    38   47.35$
 60%                112%    43   52.62$
 70%                102%    49   57.60$
 80%                 95%    54   62.21$
 90%                 81%    65   72.44$
 95%                 77%    69   76.48$
100%                 43%   133   136$

Portfolio analysis  OptF  ProF  Win/Loss   Wgt%

EUR/USD             .999  32.94    6/2    100.0
EUR/USD:L           .999  16.14    2/2     47.4
EUR/USD:S           .1000  ++++    4/0     52.6
Conclusion
Wow, that’s an impressive result! An Annual Return of 126% with a Sharpe Ratio of 0.90 is astounding. We can more than double or money every year while we sleep, and we are taking only a little more risk than the market risk. We won 75% of our trades, and most the trades are very long, but in the end it shouldn’t matter, since we make a lot of money… What a marvelous get-rich-quick strategy!
Now, before you go and download Zorro Trader to live trade this strategy, please stop, and think! Is this too good to be true? If it is, you know what that means. Are we overfitting here? But how, because we did not play with any of the parameters? Or are we just lucky? Luck should play no role in algorithmic trading. Before live trading any strategy, we need answers to these questions.
by Algo Mike
Experienced algorithmic and quantitative trading professional.