Forum
Please ask all Zorro Trader questions in the Zorro Trader forum. You need to sign up first.
ADX/RSI strategy on SP500
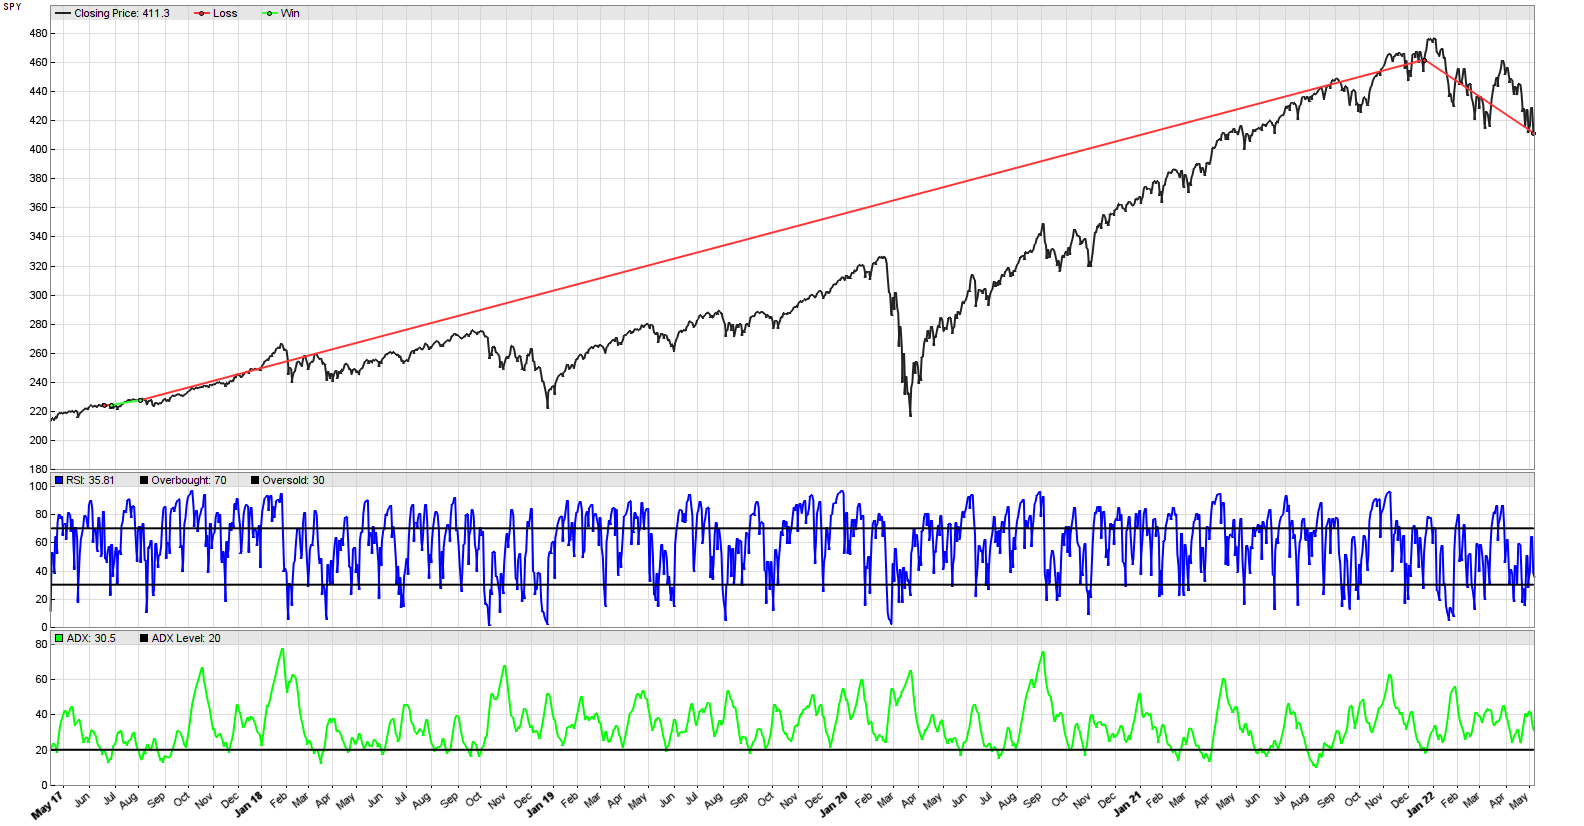
Quote from TraderJoe on May 19, 2022, 9:19 amHi, I tried your ADX/RSI trend following script on the SP500 (data from Yahoo Finance). The strategy does not work at all. It seems to work on your forex pair though. Why is that? Should I try optimizing the parameters, or is there a fundamental reason for the flop?
Hi, I tried your ADX/RSI trend following script on the SP500 (data from Yahoo Finance). The strategy does not work at all. It seems to work on your forex pair though. Why is that? Should I try optimizing the parameters, or is there a fundamental reason for the flop?
Uploaded files:Quote from frutza on May 19, 2022, 4:09 pmi think it is because sp500 is not mean reverting. will try it on some mean reverting stock, if i can find any.
i think it is because sp500 is not mean reverting. will try it on some mean reverting stock, if i can find any.
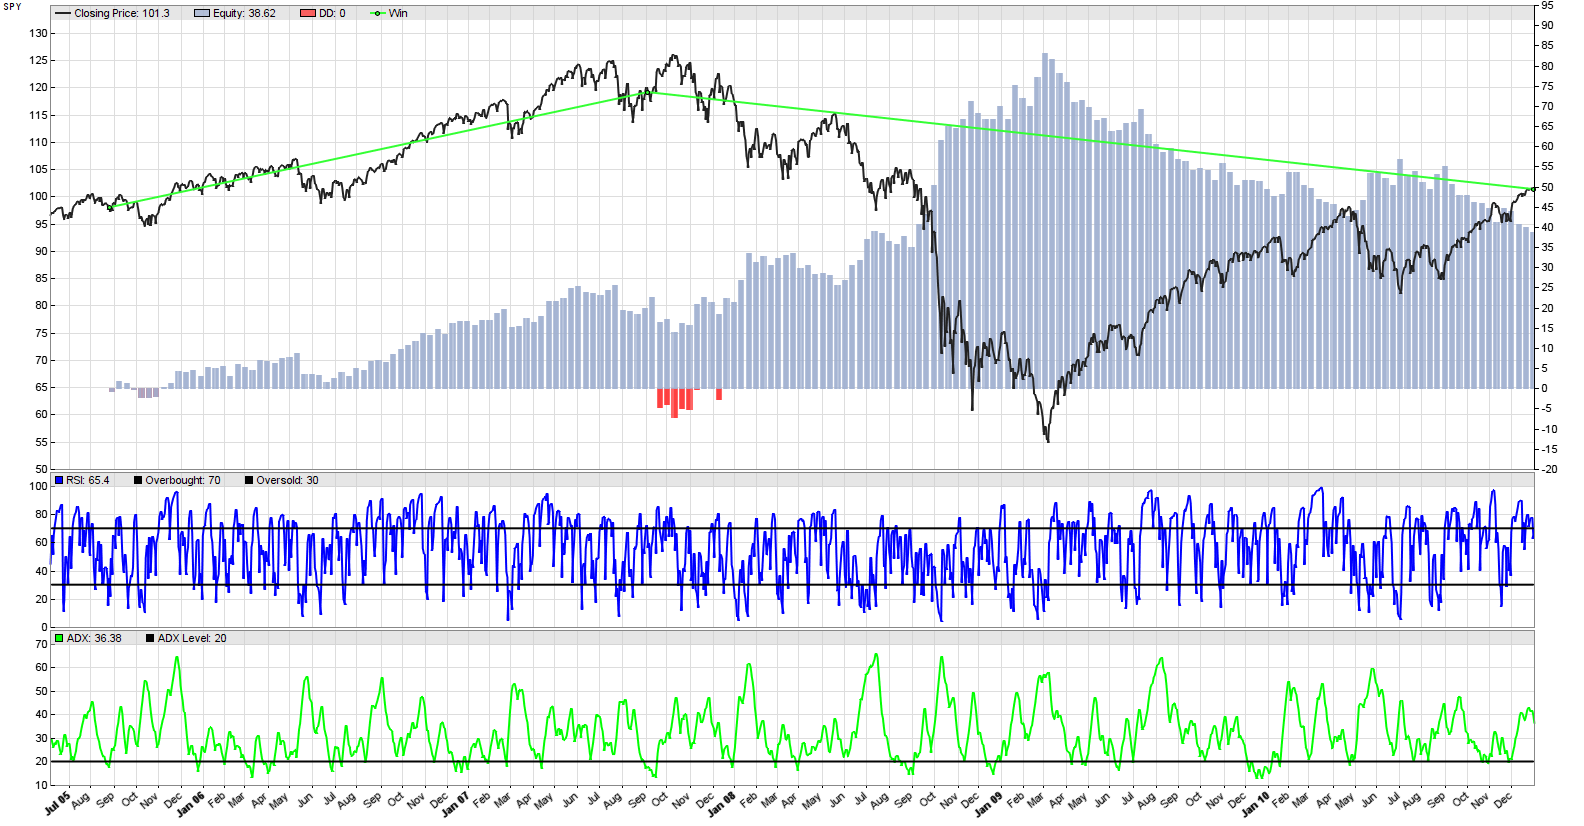
Quote from TraderJoe on May 19, 2022, 4:28 pmI tried again, this time from 2005 to 2010. At the end of 2010, the SP500 reverted to the price level of 2005. It kind of worked this time, although the annual return is only 6%. This strategy may have potential, but I think it is too simple, and it does not trade enough. At least not with these parameters. Any ideas?
I tried again, this time from 2005 to 2010. At the end of 2010, the SP500 reverted to the price level of 2005. It kind of worked this time, although the annual return is only 6%. This strategy may have potential, but I think it is too simple, and it does not trade enough. At least not with these parameters. Any ideas?
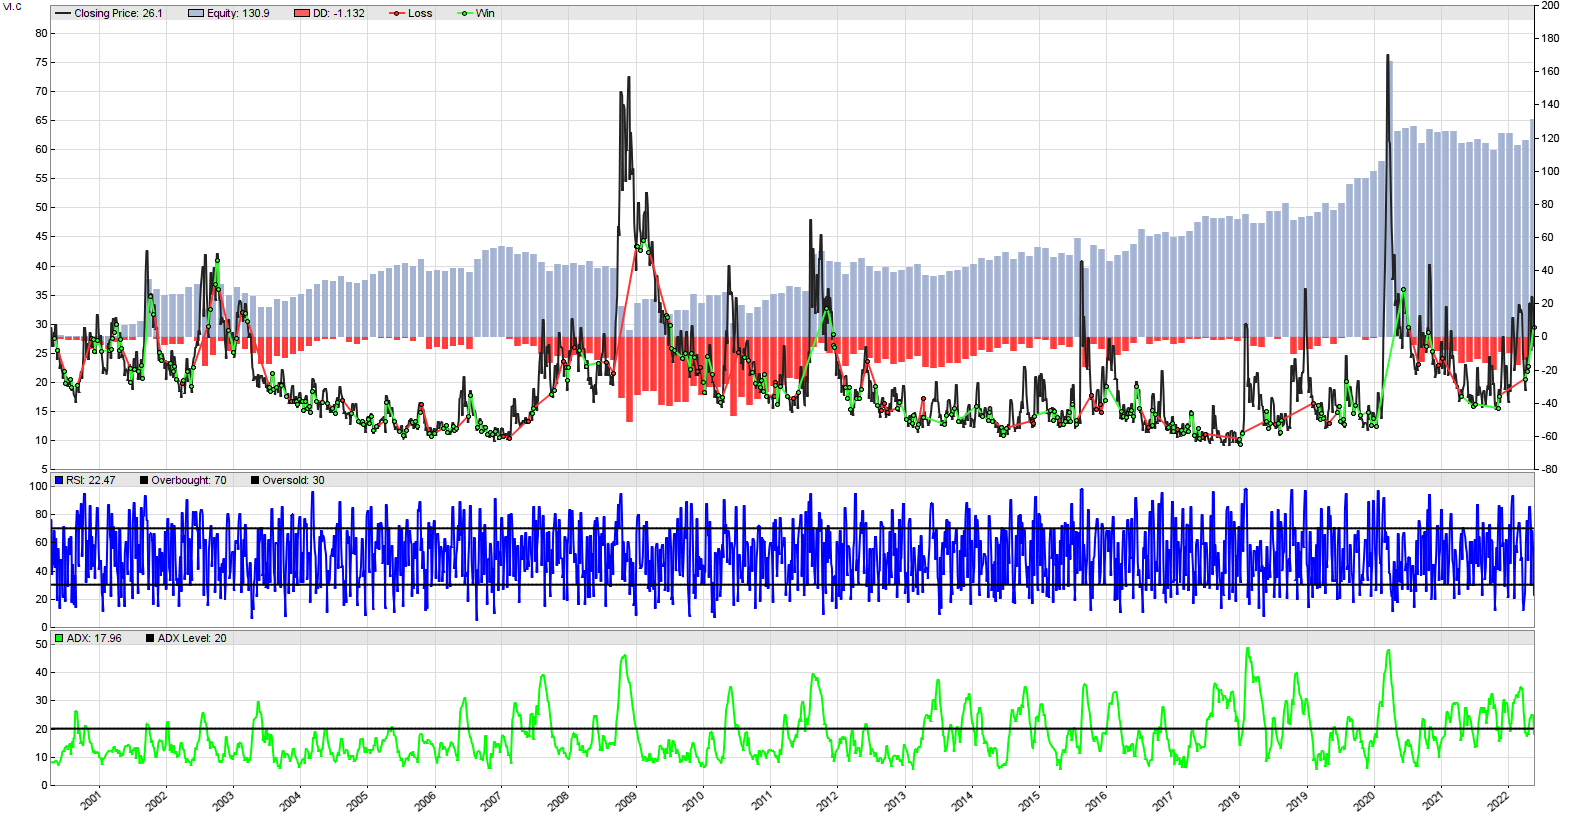
Uploaded files:Quote from frutza on May 23, 2022, 11:54 amhere is a backtest of the strategy on S&P 500 VIX Cash (VI.C) on historical data from stooq. full code:
function run()
{ set(PARAMETERS + LOGFILE + PLOTNOW);
BarPeriod = 1440;
MaxLong = MaxShort = 1;StartDate = 19970101;
EndDate = 20220620;var opt = optimize(2,2,50,1);
var overbought_level = 70;
var oversold_level = 30;
var rsi_period = 4;
var adx_period = 20;
var adx_level = 20;vars price = series(priceClose());
vars rsi = series(RSI(price, rsi_period));
vars adx = series(ADX(adx_period));if(adx[0] < adx_level) {
if(crossOver(rsi, oversold_level)) enterLong();
if(crossUnder(rsi, overbought_level)) enterShort();
}plot("RSI", rsi, LINE|NEW, BLUE);
plot("Overbought", overbought_level, LINE, BLACK);
plot("Oversold", oversold_level, LINE, BLACK);
plot("ADX", adx, LINE|NEW, GREEN);
plot("ADX Level", adx_level, LINE, BLACK);
}i changed the ADX formation period from 7 days to 20. here's the report.
Annual return 8%
Profit factor 1.49 (PRR 1.27)
Sharpe ratio 0.20 (Sortino 0.19)
Kelly criterion 0.48
Annualized StdDev 41.18%
R2 coefficient 0.414
Ulcer index 17.3%this strategy is VERY dependent on the ADX formation period, so handle with care!
here is a backtest of the strategy on S&P 500 VIX Cash (VI.C) on historical data from stooq. full code:
function run()
{ set(PARAMETERS + LOGFILE + PLOTNOW);
BarPeriod = 1440;
MaxLong = MaxShort = 1;StartDate = 19970101;
EndDate = 20220620;var opt = optimize(2,2,50,1);
var overbought_level = 70;
var oversold_level = 30;
var rsi_period = 4;
var adx_period = 20;
var adx_level = 20;vars price = series(priceClose());
vars rsi = series(RSI(price, rsi_period));
vars adx = series(ADX(adx_period));if(adx[0] < adx_level) {
if(crossOver(rsi, oversold_level)) enterLong();
if(crossUnder(rsi, overbought_level)) enterShort();
}plot("RSI", rsi, LINE|NEW, BLUE);
plot("Overbought", overbought_level, LINE, BLACK);
plot("Oversold", oversold_level, LINE, BLACK);
plot("ADX", adx, LINE|NEW, GREEN);
plot("ADX Level", adx_level, LINE, BLACK);
}
i changed the ADX formation period from 7 days to 20. here's the report.
Annual return 8%
Profit factor 1.49 (PRR 1.27)
Sharpe ratio 0.20 (Sortino 0.19)
Kelly criterion 0.48
Annualized StdDev 41.18%
R2 coefficient 0.414
Ulcer index 17.3%
this strategy is VERY dependent on the ADX formation period, so handle with care!
Uploaded files:Quote from Algo Mike on July 16, 2022, 1:46 pmfrutza, you are correct. The strategy depends heavily on a single parameter, which makes it a good teaching tool, but not a good strategy for live trading.
frutza, you are correct. The strategy depends heavily on a single parameter, which makes it a good teaching tool, but not a good strategy for live trading.


