Forum
Please ask all Zorro Trader questions in the Zorro Trader forum. You need to sign up first.
Simple example of Zorro Trader and R connectivity.
Quote from TraderJoe on November 5, 2023, 10:15 pmHi Zorro traders!
Can someone please provide a simple example of how I can pass some historical price data from Zorro Trader to R, perform a statistical test on those values, and then return the results to Zorro? For example, let's say I have my last n=200 closing prices of an asset, and I want to know if this price series is mean reverting. I would like to pass the 200 closing prices from Zorro Trader to R, perform an Augmented Dickey-Fuller test, and return the result to Zorro. Can this be done without an "external" R file, just directly from Zorro Trader?
Thank you all!
Hi Zorro traders!
Can someone please provide a simple example of how I can pass some historical price data from Zorro Trader to R, perform a statistical test on those values, and then return the results to Zorro? For example, let's say I have my last n=200 closing prices of an asset, and I want to know if this price series is mean reverting. I would like to pass the 200 closing prices from Zorro Trader to R, perform an Augmented Dickey-Fuller test, and return the result to Zorro. Can this be done without an "external" R file, just directly from Zorro Trader?
Thank you all!
Quote from Algo Mike on January 28, 2024, 5:46 pmHi TraderJoe!
I guess you tried to run the ADF code from the Zorro Manual (here) and it didn't work 🙂
That is because, for whatever reason, they omitted to include in the code the file r.h which is necessary in order for Zorro to communicate with R.
Here's my version of the code, which works fine:
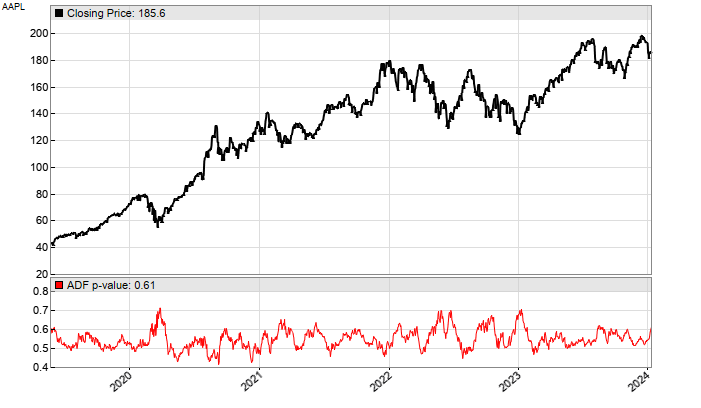
#include<r.h>function run(){set(PLOTNOW);BarPeriod = 1440;LookBack = 100;if(Init) {if(!Rstart())return quit("Error - R won't start!");Rx("rm(list = ls());"); // clear the workspaceRx("library(tseries)"); // load time series library}if(is(LOOKBACK)) return;Rset("Data",rev(seriesC()),200); // send Close series to RRx("ADF = adf.test(Data)"); // Augmented Dickey-Fuller testprintf("\nADF p=%.3f", Rd("ADF$p.value"));plot("ADF p-value",Rd("ADF$p.value"),NEW,RED); //display p-value}It prints and plots the ADF p values for you 🙂 Please note that I changed their original code a bit. When sending the prices to R, instead of using the LookBack period (like in the original code) I used 200 days, as you asked. Let me know if you have any other questions!
Hi TraderJoe!
I guess you tried to run the ADF code from the Zorro Manual (here) and it didn't work 🙂
That is because, for whatever reason, they omitted to include in the code the file r.h which is necessary in order for Zorro to communicate with R.
Here's my version of the code, which works fine:
#include<r.h>function run(){set(PLOTNOW);BarPeriod = 1440;LookBack = 100;if(Init) {if(!Rstart())return quit("Error - R won't start!");Rx("rm(list = ls());"); // clear the workspaceRx("library(tseries)"); // load time series library}if(is(LOOKBACK)) return;Rset("Data",rev(seriesC()),200); // send Close series to RRx("ADF = adf.test(Data)"); // Augmented Dickey-Fuller testprintf("\nADF p=%.3f", Rd("ADF$p.value"));plot("ADF p-value",Rd("ADF$p.value"),NEW,RED); //display p-value}


