How robust is our Zorro Trader ADX and RSI strategy?

May 18, 2022by Algo Mike0
Zorro_Trader_ADX_RSI_EURUSD-1280x667.png

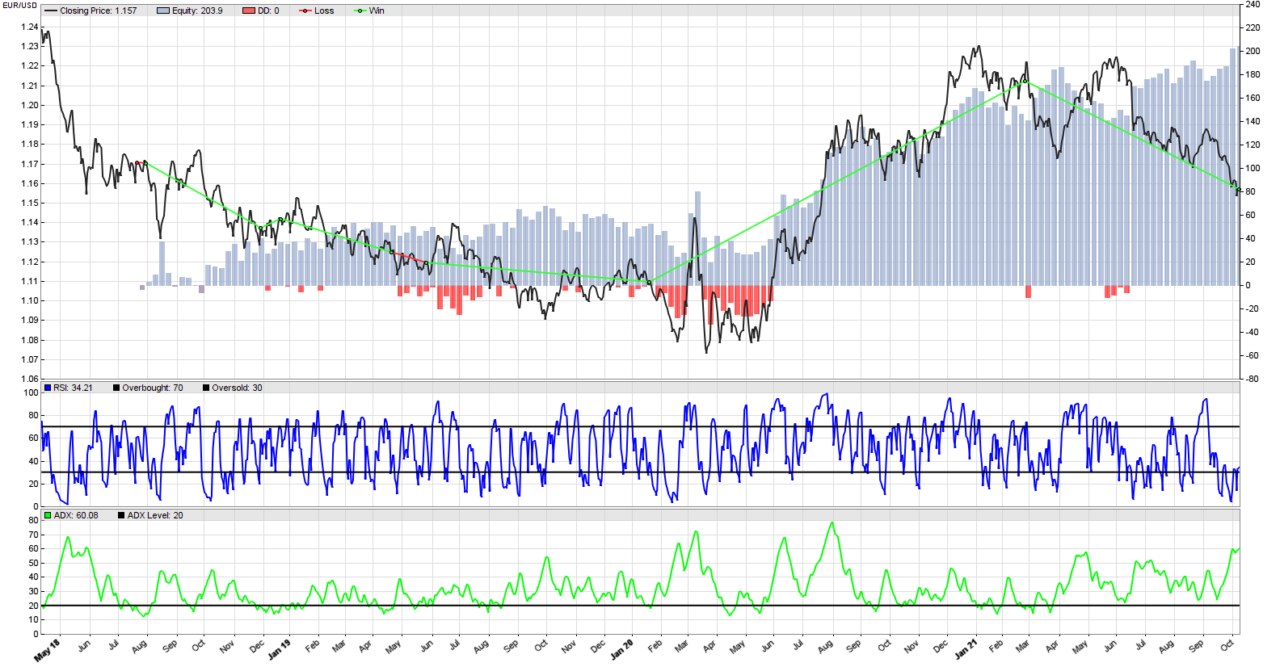
We managed to produce a terrific Zorro Trader back-test of our ADX and RSI trend following strategy on the mean-reverting EUR/USD pair. The equity curve is above, and the trades look beautiful. But the market does not rewards us for beautiful equity curves or impressive back-tests. It only rewards us for creating robust systematic trading strategies that work equally well in the future as they did in the past. And one important condition for that to happen is what we stated before: a strategy should not depend heavily on the values we set for its parameters.

In a previous post we examined how the RSI strategy behaved when changing its parameters. In this post we examine what happens when we change the formation period of the ADX indicator. We will not change the value for the level that shows the presence or absence of a trend, because that value was established by Welles Wilder, the creator of ADX. But feel free to play with that value as well. Let’s see what happens if we change the value of the formation period from 7 days so 6 days.

Zorro Trader back-test: changing the ADX formation period from 7 days to 6 days

Zorro Trader
Zorro Trader Trend Following ADX and RSI on EUR/USD ADX: 6 days

Wow, what a difference one day makes! All our nice trades are gone. We entered a short position at the beginning of the back-test, and stayed in it until the end. Clearly, we did not exit the position because of a signal, but because the back-test ended. And we made a meager Annual Return of 0.2% with a Sharpe Ratio of 0. EUR/USD is mean reverting so the price ended close to where it started. And we accomplished all this by shortening the ADX formation period by a single day! Let’s see what happens if we make it one day longer.

Changing the ADX formation period from 7 days to 8 days

Zorro Trader
Zorro Trader Trend Following ADX and RSI on EUR/USD ADX: 8 days

Now that’s not that terrible. Most of our trades are back, but some of them are now bad trades instead of good ones. One day more added to the ADX formation period got us an Annual Return of 72% with a Sharpe Ratio of 0.73. We make a little more than half the money we were making with the 7 days formation period, but 72% is still great. The Sharpe Ratio went down a little, though. Let’s see what happens if we make the formation period 11 days.

Zorro Trader: changing the ADX formation period from 7 days to 11 days

Zorro Trader
Zorro Trader Trend Following ADX and RSI on EUR/USD ADX: 11 days

Now we really did wreck it! We are loosing 4% per year on average, although in the beginning we did have some winning trades. The Sharpe Ratio is negative, which is terrible, and our equity curve does not look so pretty anymore. We managed to turn an amazing strategy into a failing one by relatively small changes to the ADX formation period, in either direction.

Conclusion

Although our initial idea seemed clever, and the initial back-test looked astounding, further exploration reveals that our algorithmic trading strategy depends very heavily on a single parameter. We did not perform an exhaustive search in the ADX formation period space, but we realized rather quickly that only about two values generate profits for us. This is not a good thing. Market conditions change, and these two values may or may not work in the future. But there is no way to know that in advance…

by Algo Mike

Experienced algorithmic and quantitative trading professional.