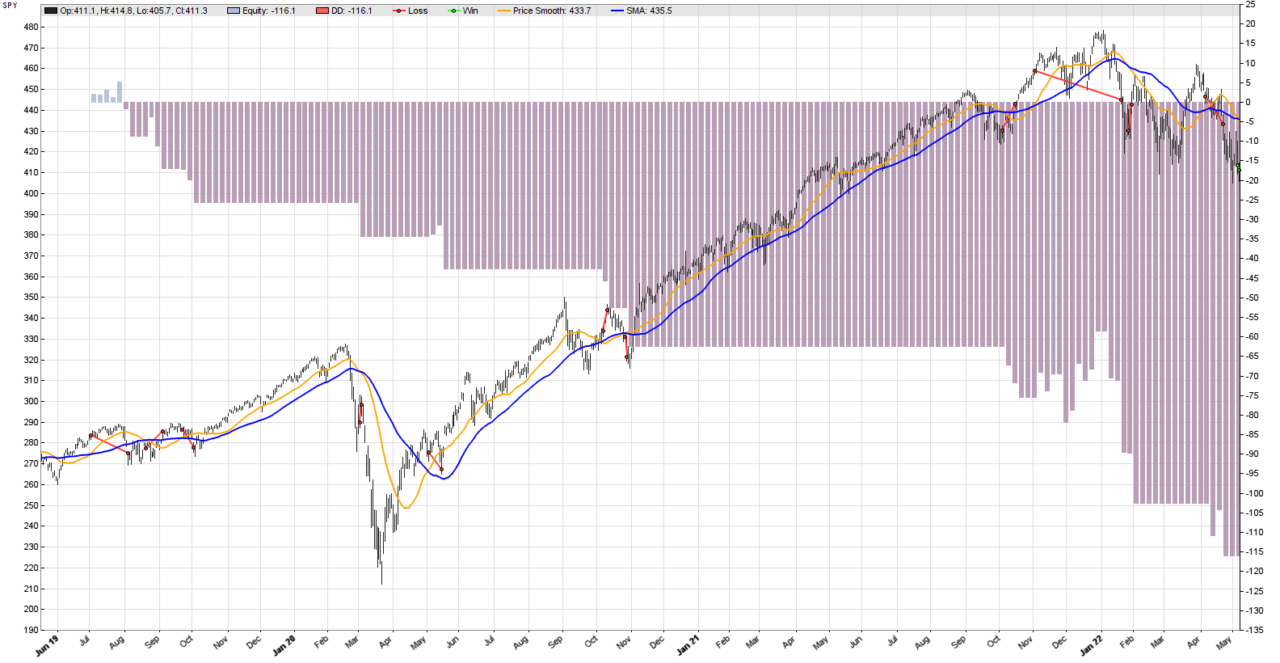
This Zorro Trader Results picture shows clearly that our simple systematic trading strategy stops working in June 2019. All the trades we entered during or after that month ended up loosing money. However, a closer look reveals that the potential for profit was there. If we examine the moving averages crossover signals, it is very easy to see that the signals do capture the trends really well. The culprit jumps to the eye immediately: it is the stop loss.
Most of the time we do enter the trades at the right moment, but then we get stopped out pretty quickly. Let’s remove the stop loss in Zorro Trader, by commenting out its line of code, like this:
function run()
{
	BarPeriod = 1440;

	StartDate = 20170601;
	EndDate = 20220506;

	//Stop = 0.03*priceClose();
	//This is a comment. We just "commented out" the stop loss above.

	vars price = series(priceClose());
	vars price_smooth = series(SMA(price, 25));
	vars sma = series(SMA(price, 50));

	if(crossOver(price_smooth, sma)) enterLong();
	if(crossUnder(price_smooth, sma)) enterShort();

	plot("Price Smooth", price_smooth, LINE, ORANGE);
	plot("SMA", sma, LINE, BLUE);
}
Comments and “commenting out” in Zorro Trader
In Lite-C, and C, and in most other programming languages, the programmers can (and should!) insert comments to explain what the code does. These are either “notes to self” which help in the future when human memory fails, or explanatory notes for someone else (programmer or not) who may not understand the code. A comment is marked by a double slash at its beginning.
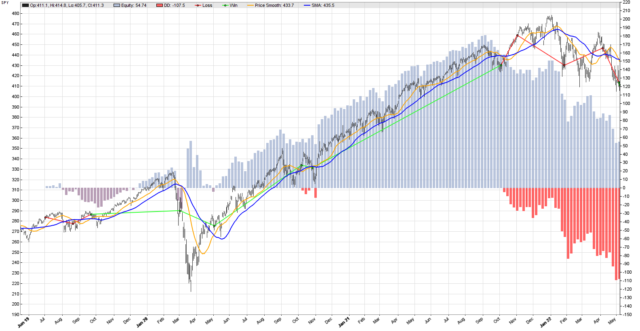
Anything from the double slash to the end of the line is ignored by Zorro Trader and is not executed. So a clever trick is to use commenting to disable a line of code without deleting it. We may still want that line of code later, and we can simply “un-comment” it at any time, by removing the double slash. Here is our equity curve after “commenting out” the stop loss.

Performance analysis without stop loss
Test WithStopLoss SPY, Zorro 2.444

Simulated account   AssetsFix
Bar period          24 hours (avg 2085 min)
Total processed     1215 bars
Test period         2019-06-03..2022-05-06 (739 bars)
Lookback period     80 bars (23 weeks)
Montecarlo cycles   200
Simulation mode     Realistic (slippage 5.0 sec)
Avg bar             437.4 pips range
Spread              10.0 pips (roll 0.00/0.00)
Commission          0.02
Contracts per lot   1.0

Gross win/loss      180$-123$, +5720.9p, lr 182$
Average profit      19.57$/year, 1.63$/month, 0.0753$/day
Max drawdown        -109$ 190.4% (MAE -127$ 222.8%)
Total down time     36% (TAE 82%)
Max down time       41 weeks from Oct 2021
Max open margin     459$
Max open risk       4.71$
Trade volume        4258$ (1456$/year)
Transaction costs   -1.20$ spr, 0.61$ slp, 0$ rol, -0.24$ com
Capital required    569$

Number of trades    12 (5/year)
Percent winning     50.0%
Max win/loss        99.01$ / -33.17$
Avg trade profit    4.77$ 476.7p (+3001.2p / -2047.7p)
Avg trade slippage  0.0507$ 5.1p (+16.5p / -6.4p)
Avg trade bars      59 (+85 / -34)
Max trade bars      236 (68 weeks)
Time in market      97%
Max open trades     1
Max loss streak     4 (uncorrelated 4)

Annual return       3%
Profit factor       1.47 (PRR 0.62)
Sharpe ratio        0.26 (Sortino 0.24)
Kelly criterion     2.01
Annualized StdDev   12.78%
R2 coefficient      0.000
Ulcer index         22.7%
Scholz tax          15 EUR

Year Jan Feb Mar Apr May Jun Jul Aug Sep Oct Nov Dec Total
2019                           0  -2  -1   1   2   2    +2
2020  -0  -4   8  -6   5   1   3   4  -2  -1   6   2   +16
2021  -1   2   3   4   0   2   2   2  -4  -4  -2   4    +8
2022 -11   2  -3  -5   1                               -16

Confidence level     AR   DDMax  Capital
 10%                  4%    44   503$
 20%                  4%    48   508$
 30%                  4%    54   513$
 40%                  4%    59   519$
 50%                  4%    66   526$
 60%                  4%    72   531$
 70%                  4%    82   542$
 80%                  4%    93   553$
 90%                  3%   114   574$
 95%                  3%   131   592$
100%                  3%   219   680$

Portfolio analysis  OptF  ProF  Win/Loss   Wgt%

SPY                 .999  1.47    6/6     100.0
SPY:L               .999  2.35    3/3     161.4
SPY:S               .000  0.36    3/3     -61.4
Darn it, stop loss!
Well, it appears the stop loss really is the culprit, as we thought. Removing the stop loss improves things and turns a losing strategy into a winning one, at least during this period of the back-test. But how do we reconcile this with the idea that a stop loss is good, and should be used? Well, how about keeping the stop loss, but changing its level?
Changing the stop loss in Zorro Trader
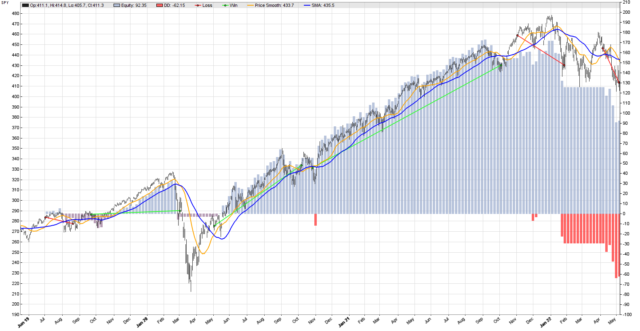
Now we can simply un-comment our stop loss line by deleting the double backslash at the beginning. We decide to change the value of the stop loss, and by a lot. A small change may not make a difference, but if we are right, a big change should. We still keep the benefits of a stop loss, but we will take on more risk this time. So let’s set the stop loss at 90%, like this: Stop = 0.9*priceClose(); The new equity curve is below.

Performance analysis with the new stop loss at 90%
Test WithStopLoss SPY, Zorro 2.444

Simulated account   AssetsFix
Bar period          24 hours (avg 2085 min)
Total processed     1215 bars
Test period         2019-06-03..2022-05-06 (739 bars)
Lookback period     80 bars (23 weeks)
Montecarlo cycles   200
Simulation mode     Realistic (slippage 5.0 sec)
Avg bar             437.4 pips range
Spread              10.0 pips (roll 0.00/0.00)
Commission          0.02
Contracts per lot   1.0

Gross win/loss      161$-68.37$, +9235.3p, lr 200$
Average profit      31.58$/year, 2.63$/month, 0.12$/day
Max drawdown        -63.70$ 69.0% (MAE -82.11$ 88.9%)
Total down time     28% (TAE 60%)
Max down time       20 weeks from Jan 2022
Max open margin     459$
Max open risk       46.01$
Trade volume        2082$ (712$/year)
Transaction costs   -0.60$ spr, 0.16$ slp, 0$ rol, -0.12$ com
Capital required    523$

Number of trades    6 (3/year)
Percent winning     50.0%
Max win/loss        99.01$ / -33.17$
Avg trade profit    15.39$ 1539.2p (+5357.4p / -2279.0p)
Avg trade slippage  0.0271$ 2.7p (+18.2p / -12.8p)
Avg trade bars      94 (+152 / -37)
Max trade bars      236 (68 weeks)
Time in market      77%
Max open trades     1
Max loss streak     2 (uncorrelated 3)

Annual return       6%
Profit factor       2.35 (PRR 0.63)
Sharpe ratio        0.60 (Sortino 0.52)
Kelly criterion     5.98
Annualized StdDev   10.04%
R2 coefficient      0.396
Ulcer index         11.0%
Scholz tax          24 EUR

Year Jan Feb Mar Apr May Jun Jul Aug Sep Oct Nov Dec Total
2019                           0  -1  -0   1   2   2    +3
2020  -0  -5   1   0   4   1   3   4  -2  -1   7   3   +14
2021  -1   2   3   4   1   2   2   2  -4   1  -1   4   +15
2022  -8   0   0  -7   0                               -15

Confidence level     AR   DDMax  Capital
 10%                  7%    25   484$
 20%                  6%    29   488$
 30%                  6%    31   490$
 40%                  6%    33   492$
 50%                  6%    37   496$
 60%                  6%    40   499$
 70%                  6%    42   502$
 80%                  6%    49   508$
 90%                  6%    61   521$
 95%                  6%    69   528$
100%                  5%   122   583$

Portfolio analysis  OptF  ProF  Win/Loss   Wgt%

SPY                 .999  2.35    3/3     100.0
SPY:L               .999  2.35    3/3     100.0
SPY:S               .000  ----    0/0       0.0
Conclusion
Nicely done! Now the performance of our strategy is almost the same in the second period of the initial back-test as the performance during the first period. The market changed, so our stop loss needed adjustment. Removing it improved things a bit, but changing it to 90% really did the trick. One major question remains, though. This whole process worked due to the wisdom of the years passed.
We are now in 2022, and we now know that on June 2019, we should have changed the stop loss from 3% to 90%. But, again, now is 2022. Could we have known this in June 2019? And what magical crystal ball could have told us? To find the answer to these questions, and learn more about Zorro Trader, please watch the Zorro Trader tutorials and video courses in the members area.
by Algo Mike
Experienced algorithmic and quantitative trading professional.

