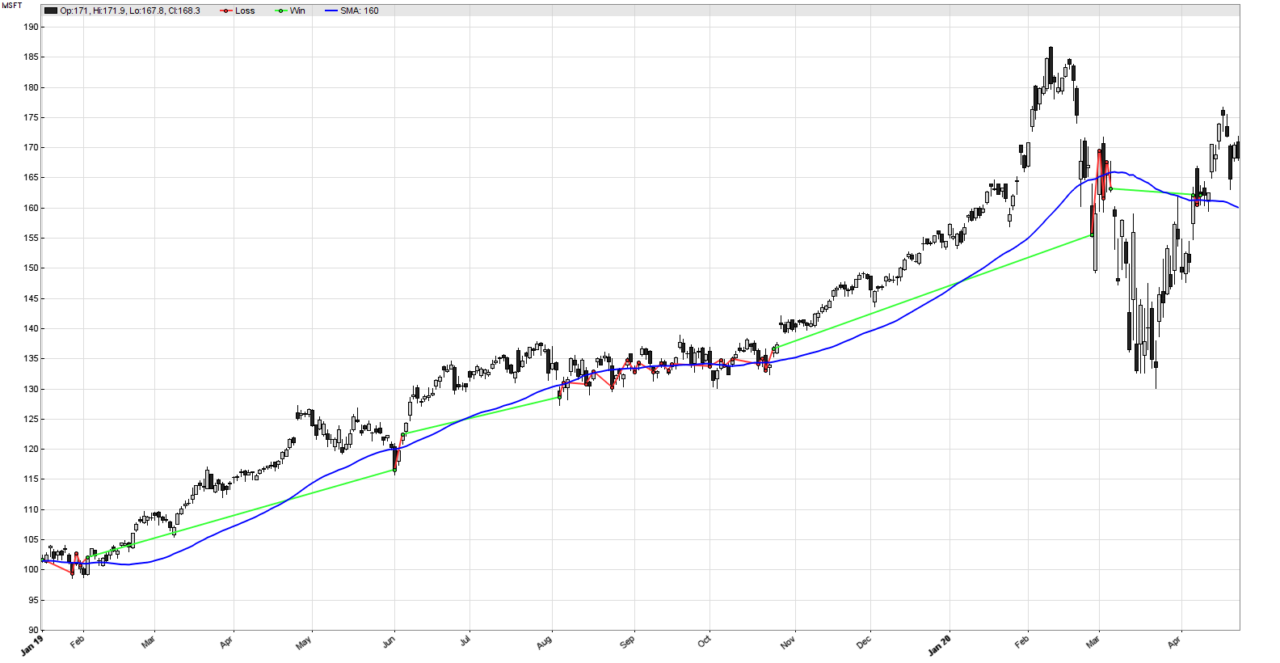
Let’s take a closer look at the bad trades that are destroying our profits in the Microsoft back-test. Clearly, our simple systematic trading strategy works, and Zorro Trader enters and exits trades profitably when a sustained trend exists. The bad trades occur almost always when the price wiggles a lot around the moving average, which usually happens when the market is in a trading range. During those periods, the moving average is almost horizontal (no trend) and the price fluctuations seem to be random noise. But they do trigger a lot of small losing trades, because there is no trend to follow – and it costs us a lot of money.
Improving the simplest systematic trading strategy in Zorro Trader
Well, here is an idea that may improve our trading strategy. What if we try to smooth the price curve? If we can make it smoother, it would still fluctuate, but probably less. And less wiggling around the moving average would mean less loosing trades. But how can we smooth the price curve? Well, by using… another moving average! We will keep the 50 days moving average as our trend indicator, but the entry and exit signals will be generated by the crossovers between the 50 days moving average and a new one, which needs to be shorter. Let’s pick 25 days for our new moving average. Here is the code for our improved strategy:
function run()
{
	BarPeriod = 1440;

	vars price = series(priceClose());
	vars price_smooth = series(SMA(price, 25));
	vars sma = series(SMA(price, 50));

	if(crossOver(price_smooth, sma)) enterLong();
	if(crossUnder(price_smooth, sma)) enterShort();

	plot("Price Smooth", price_smooth, LINE, ORANGE);
	plot("SMA", sma, LINE, BLUE);
}
As you can see, all we did was to create the new moving average price_smooth, and replace the price variable name in the trade logic. And we also added a second plot to the image so we can see the second moving average (the smoothed price) as well. Here is the visual result of testing this new version of the strategy, cropped to the part with the trading range we were examining previously. We removed the equity curve to improve visibility.
Testing the strategy on MSFT
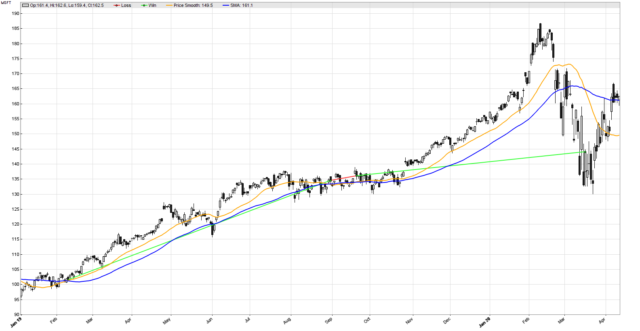
We have done well, and the idea worked! Most of the small losing trades are now gone, and the losses associated with them are gone too. But a closer comparison of the good trades (between strategies) reveals something interesting: our good trades are now worse. We are entering and exiting our trades later than we were before, which usually reduces the profits of our good trades.
This effect happens because moving averages are lagging the price curve, and the longer their formation period, the longer the lag. Unfortunately, this can’t be helped in simple moving averages. We have a trade-off here, as always in trading: less losing trades versus less profit in the winning trades. Is the trade-off here in our favor? Let’s examine the performance of the strategy:
Performance report of the Zorro Trader strategy
Test Smoothed Price MSFT, Zorro 2.444

Simulated account   AssetsFix
Bar period          24 hours (avg 2087 min)
Total processed     1953 bars
Test period         2017-04-28..2022-05-06 (1265 bars)
Lookback period     80 bars (23 weeks)
Montecarlo cycles   200
Simulation mode     Realistic (slippage 5.0 sec)
Avg bar             324.8 pips range
Spread              10.0 pips (roll 0.00/0.00)
Commission          0.02
Contracts per lot   1.0

Gross win/loss      190$-135$, +5493.8p, lr 76.10$
Average profit      10.94$/year, 0.91$/month, 0.0421$/day
Max drawdown        -74.46$ 135.5% (MAE -86.37$ 157.2%)
Total down time     35% (TAE 72%)
Max down time       57 weeks from Mar 2021
Max open margin     330$
Max open risk       3.42$
Trade volume        3878$ (772$/year)
Transaction costs   -1.90$ spr, 1.48$ slp, 0$ rol, -0.38$ com
Capital required    388$

Number of trades    19 (4/year)
Percent winning     52.6%
Max win/loss        36.67$ / -37.34$
Avg trade profit    2.89$ 289.1p (+1901.8p / -1502.6p)
Avg trade slippage  0.0780$ 7.8p (+17.0p / -2.4p)
Avg trade bars      53 (+77 / -27)
Max trade bars      140 (40 weeks)
Time in market      81%
Max open trades     1
Max loss streak     3 (uncorrelated 4)

Annual return       3%
Profit factor       1.41 (PRR 0.72)
Sharpe ratio        0.20 (Sortino 0.19)
Kelly criterion     1.48
Annualized StdDev   13.45%
R2 coefficient      0.472
Ulcer index         37.0%
Scholz tax          14 EUR

Year Jan Feb Mar Apr May Jun Jul Aug Sep Oct Nov Dec Total
2017               1   1  -0   2   2   1  -3  -1   2    +4
2019  -1   2   1   3  -2   3   1   0  -1   1   2   2   +12
2020   3  -2  -7  -3   1   5   0   5  -4   1   3   2    +6
2021   2   0  -1  -6  -0  -4   4   4  -5  -7  -0   1   -11
2022  -4   3  -2   4   3                                +4

Confidence level     AR   DDMax  Capital
 10%                  3%    29   352$
 20%                  3%    35   357$
 30%                  3%    38   360$
 40%                  3%    43   364$
 50%                  3%    48   368$
 60%                  3%    54   372$
 70%                  3%    60   376$
 80%                  3%    68   383$
 90%                  3%    85   396$
 95%                  3%   105   412$
100%                  2%   167   460$

Portfolio analysis  OptF  ProF  Win/Loss   Wgt%

MSFT                .999  1.41   10/9     100.0
MSFT:L              .999  5.59    6/3     216.3
MSFT:S              .000  0.42    4/6     -116.3
Conclusion
This is not a bad result! Our Annual Return was -5%, while now it is 3% and the Sharpe Ratio increased from -0.46% to 0.2%. Our Percent Winning trades went up from 19.8% to 52.6%. We also trade less, but that is primarily because we got rid of most of the small losing trades, and not so many of the good ones. Granted, our strategy still doesn’t “beat the market”, but that was not the point here.
We had an original idea, which worked poorly, and then we improved it with a rather clever idea, which proved to be correct. Just a simple example of strategy design and improvement. Please watch the Zorro Trader tutorial video courses in our members area.
by Algo Mike
Experienced algorithmic and quantitative trading professional.