We will try to back-test our simplest trend following strategy in Zorro Trader for two more underlying assets. We selected Apple, Inc. (AAPL) and Microsoft Corp. (MSFT) because both exhibited fairly long and sustained trends in the past, so they should be suitable for any trend following strategy. Our simplest systematic trend following strategy did not perform very well on the SPY ETF, and we want to compare the performance with these stocks. Here is the full code of the strategy again:
function run()
{
	BarPeriod = 1440;

	vars price = series(priceClose());
	vars sma = series(SMA(price, 50));

	if(crossOver(price, sma)) enterLong();
	if(crossUnder(price, sma)) enterShort();

        plot("SMA", sma, LINE, BLUE);
}
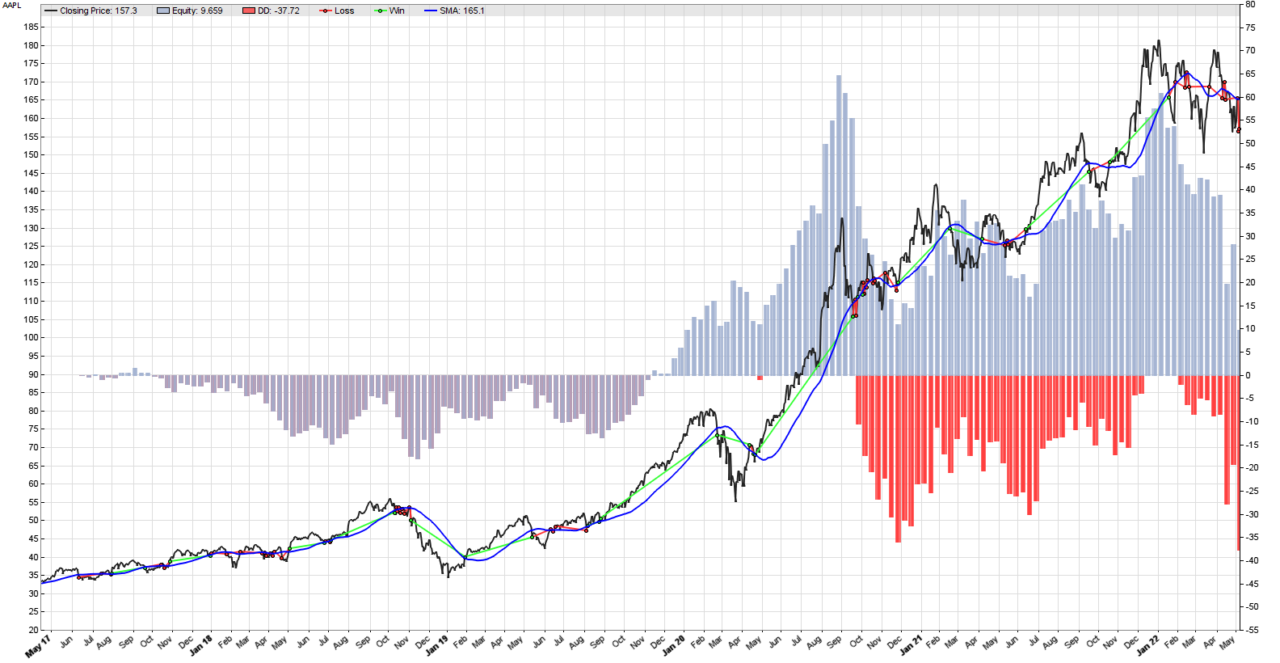
Please note that you need to select the ticker you want to back-test from Zorro Trader’s drop down menu, and both stocks need to have an entry in the AssetsFix.csv file. Of course, historical data for both need to be downloaded in advance, using Zorro Trader’s Download.c script, available already as a tool. Please see our Zorro Trader introductory videos in the members area for details. Compiling and running the code for the AAPL stock generates the results in the image above.
Performance analysis on AAPL
Test SimpleStrategy AAPL, Zorro 2.444

Simulated account   AssetsFix
Bar period          24 hours (avg 2087 min)
Total processed     1953 bars
Test period         2017-04-28..2022-05-06 (1265 bars)
Lookback period     80 bars (23 weeks)
Montecarlo cycles   200
Simulation mode     Realistic (slippage 5.0 sec)
Avg bar             175.3 pips range
Spread              10.0 pips (roll 0.00/0.00)
Commission          0.02
Contracts per lot   1.0

Gross win/loss      142$-133$, +891.9p, lr 57.60$
Average profit      1.78$/year, 0.15$/month, 0.0068$/day
Max drawdown        -38.46$ 431.3% (MAE -65.23$ 731.4%)
Total down time     75% (TAE 92%)
Max down time       97 weeks from Jul 2017
Max open margin     173$
Max open risk       1.85$
Trade volume        6839$ (1362$/year)
Transaction costs   -8.10$ spr, 0.23$ slp, 0$ rol, -1.62$ com
Capital required    202$

Number of trades    81 (17/year)
Percent winning     19.8%
Max win/loss        37.71$ / -9.36$
Avg trade profit    0.11$ 11.0p (+888.1p / -204.9p)
Avg trade slippage  0.0028$ 0.3p (+10.7p / -2.3p)
Avg trade bars      15 (+50 / -6)
Max trade bars      124 (35 weeks)
Time in market      98%
Max open trades     1
Max loss streak     11 (uncorrelated 23)

Annual return       1%
Profit factor       1.07 (PRR 0.71)
Sharpe ratio        0.07 (Sortino 0.06)
Kelly criterion     0.46
Annualized StdDev   14.43%
R2 coefficient      0.081
Ulcer index         54.8%
Scholz tax          2 EUR

Year Jan Feb Mar Apr May Jun Jul Aug Sep Oct Nov Dec Total
2017                       0  -1   2  -1  -1   0  -0    -1
2018  -0  -0  -2  -3  -0  -1   0   5  -0  -6   1   2    -3
2019  -1   1   2   1  -0  -4   2  -3   2   3   2   3    +9
2020   2   2   2  -3   3   6   7  11 -16  -5  -7   7    +8
2021  -0   4  -0  -1  -3   0   4   3  -1  -3   8   6   +17
2022  -6  -5   1  -5  -9                               -25

Confidence level     AR   DDMax  Capital
 10%                  1%    13   182$
 20%                  1%    15   184$
 30%                  1%    17   186$
 40%                  1%    18   187$
 50%                  1%    21   189$
 60%                  1%    24   191$
 70%                  1%    27   193$
 80%                  1%    31   196$
 90%                  1%    36   201$
 95%                  1%    44   207$
100%                  1%    62   220$

Portfolio analysis  OptF  ProF  Win/Loss   Wgt%

AAPL                .436  1.07   16/65    100.0
AAPL:L              .999  2.08   12/28    738.7
AAPL:S              .000  0.21    4/37    -638.7
The results for the AAPL back-test are even worse than for the SPY. We make less in profits, and take on even more risk. And the problem seems to be exactly the same: the nice profits we make during the sustained trends are eaten up by lots and lots of small loosing trades during the periods when the price goes sideways. It appears that changing the underlying asset did not do much to improve our results, so we need to think of something else to improve our simple systematic strategy. Just to confirm the idea, we are running the back-test again, this time for MSFT. Here are the results:
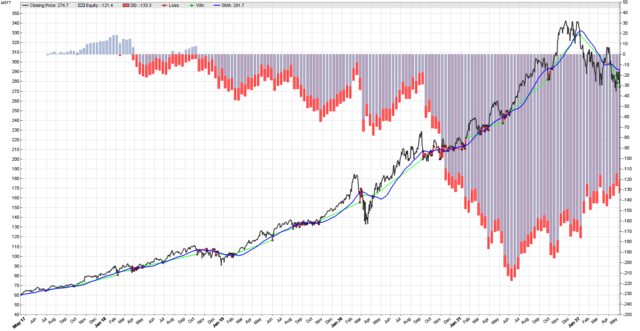
The effect we noticed, a few big wins and a lot of small losses, can rarely be seen as clearly as here. Our simple strategy catches all the major moves of the Microsoft stock, but bleeds all the profits to death during narrow trading ranges. We end up loosing money (negative Annual Returns), taking on a lot of risk (negative Sharpe Ratio), and an absolutely horrible equity curve.
Performance analysis on MSFT – Zorro Trader
Test SimpleStrategy MSFT, Zorro 2.444

Simulated account   AssetsFix
Bar period          24 hours (avg 2087 min)
Total processed     1953 bars
Test period         2017-04-28..2022-05-06 (1265 bars)
Lookback period     80 bars (23 weeks)
Simulation mode     Realistic (slippage 5.0 sec)
Avg bar             324.8 pips range
Spread              10.0 pips (roll 0.00/0.00)
Commission          0.02
Contracts per lot   1.0

Gross win/loss      224$-343$, -11862.8p, lr -201$
Average profit      -23.63$/year, -1.97$/month, -0.0909$/day
Max drawdown        -220$ -185.8% (MAE -230$ -193.9%)
Total down time     83% (TAE 93%)
Max down time       242 weeks from Feb 2018
Max open margin     328$
Max open risk       3.40$
Trade volume        18774$ (3739$/year)
Transaction costs   -11.10$ spr, 2.00$ slp, 0$ rol, -2.22$ com
Capital required    499$

Number of trades    111 (23/year)
Percent winning     16.2%
Max win/loss        37.97$ / -14.08$
Avg trade profit    -1.07$ -106.9p (+1244.2p / -368.4p)
Avg trade slippage  0.0180$ 1.8p (+25.6p / -2.8p)
Avg trade bars      11 (+50 / -3)
Max trade bars      105 (30 weeks)
Time in market      97%
Max open trades     1
Max loss streak     21 (uncorrelated 30)

Annual return       -5%
Profit factor       0.65 (PRR 0.45)
Sharpe ratio        -0.46 (Sortino -0.43)
Kelly criterion     -4.33
Annualized StdDev   10.59%
R2 coefficient      0.643
Ulcer index         100.0%

Year Jan Feb Mar Apr May Jun Jul Aug Sep Oct Nov Dec Total
2017                      -0   0   0  -0   2   0   0    +3
2018   2  -1  -3  -3   1  -0   1   1   0  -2  -2  -2    -7
2019  -2   1   1   2  -1  -0   0  -3  -2  -2   2   1    -3
2020   2  -3  -4   1   1   4   0   4  -8  -7  -7   1   -15
2021  -6   0  -9   3  -7   3   3   3  -3   4  -0  -0    -9
2022   2   2   1   2   1                                +8

Portfolio analysis  OptF  ProF  Win/Loss   Wgt%

MSFT                .000  0.65   18/93    100.0
MSFT:L              .999  1.36   14/41    -38.7
MSFT:S              .000  0.24    4/52    138.7
Clearly, we need a solution to this “death by a thousand cuts” problem, which plagues pretty much all trend following strategies. If we could somehow get rid of the small loosing trades, or not trade during trading ranges, this wouldn’t be such a terrible systematic trading strategy. But is this even possible? And how? We will explore these issues in a video course, available in the members area.
by Algo Mike
Experienced algorithmic and quantitative trading professional.