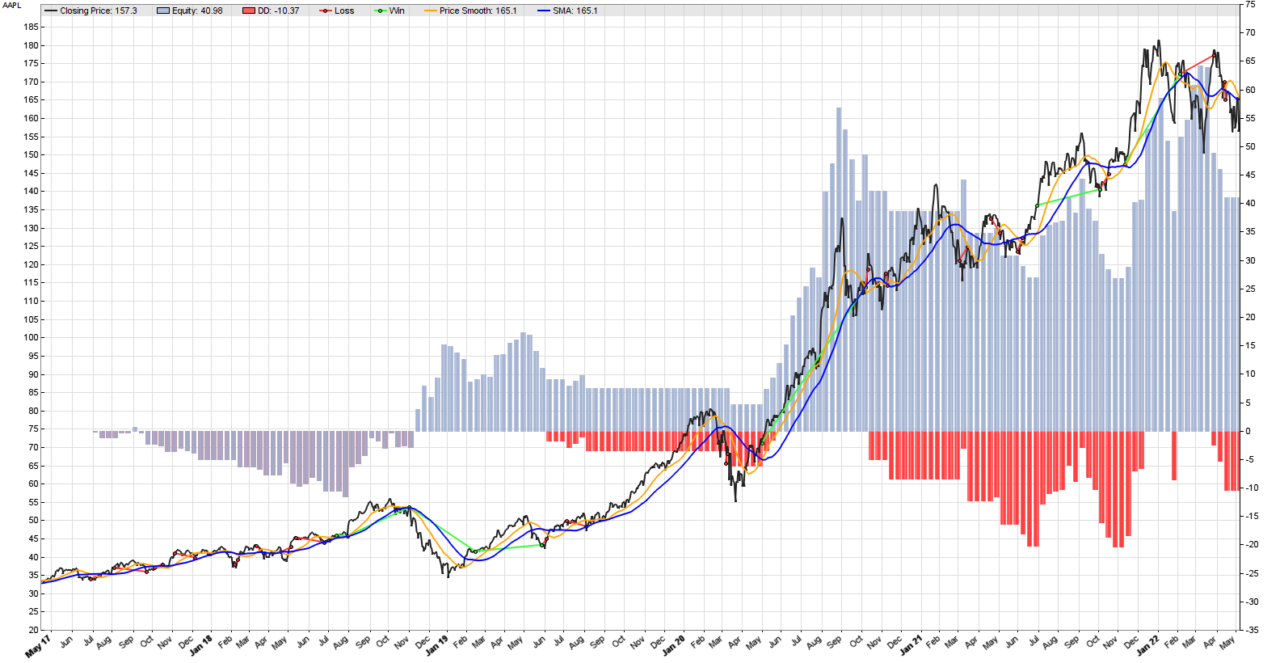
We found that our two moving averages trend following systematic strategy works better with a simple stop loss, or at least it works better on MSFT. In this post, we will experiment with AAPL and SPY. If the new strategy generates improved performance on these securities as well, we may consider this an indication that we are up to something here, and further investigating this strategy makes sense. If not, then we would like to know why. So we will back-test the strategy again in Zorro Trader, but this time for AAPL and SPY. Let’s start with Apple, Inc. The Lite-C code is the same, and the result is in the picture above. The detailed performance review is below.
Test WithStopLoss AAPL, Zorro 2.444

Simulated account   AssetsFix
Bar period          24 hours (avg 2087 min)
Total processed     1953 bars
Test period         2017-04-28..2022-05-06 (1265 bars)
Lookback period     80 bars (23 weeks)
Montecarlo cycles   200
Simulation mode     Realistic (slippage 5.0 sec)
Avg bar             175.3 pips range
Spread              10.0 pips (roll 0.00/0.00)
Commission          0.02
Contracts per lot   1.0

Gross win/loss      92.68$-51.71$, +4097.6p, lr 60.50$
Average profit      8.16$/year, 0.68$/month, 0.0314$/day
Max drawdown        -20.46$ 49.9% (MAE -39.42$ 96.2%)
Total down time     71% (TAE 50%)
Max down time       80 weeks from Oct 2020
Max open margin     172$
Max open risk       5.28$
Trade volume        2108$ (420$/year)
Transaction costs   -2.60$ spr, -2.48$ slp, 0$ rol, -0.52$ com
Capital required    188$

Number of trades    26 (6/year)
Percent winning     26.9%
Max win/loss        42.51$ / -5.29$
Avg trade profit    1.58$ 157.6p (+1324.0p / -272.1p)
Avg trade slippage  -0.0955$ -9.6p (+5.4p / -15.1p)
Avg trade bars      26 (+65 / -11)
Max trade bars      110 (31 weeks)
Time in market      54%
Max open trades     1
Max loss streak     8 (uncorrelated 12)

Annual return       4%
Profit factor       1.79 (PRR 0.91)
Sharpe ratio        0.38 (Sortino 0.40)
Kelly criterion     3.35
Annualized StdDev   11.38%
R2 coefficient      0.657
Ulcer index         29.6%
Scholz tax          11 EUR

Year Jan Feb Mar Apr May Jun Jul Aug Sep Oct Nov Dec Total
2017                      -0  -1   1  -2  -1  -0  -1    -3
2018   0  -1  -1   1  -2  -0   0   5  -0  -1   6   3    +9
2019  -1  -0   2   1  -3  -1   1  -2   0   0   0   0    -3
2020   0   0  -1   0   4   6   8  12  -7  -3  -2   0   +17
2021   0   0  -2  -1  -1  -2   5   3  -5  -2   9   7    +9
2022  -1   3  -7  -3   0                                -8

Confidence level     AR   DDMax  Capital
 10%                  5%     7   177$
 20%                  5%     8   178$
 30%                  5%     9   179$
 40%                  5%    10   180$
 50%                  4%    12   182$
 60%                  4%    14   183$
 70%                  4%    16   184$
 80%                  4%    20   187$
 90%                  4%    24   190$
 95%                  4%    25   192$
100%                  4%    40   203$

Portfolio analysis  OptF  ProF  Win/Loss   Wgt%

AAPL                .999  1.79    7/19    100.0
AAPL:L              .999  4.07    5/8     148.5
AAPL:S              .000  0.38    2/11    -48.5
This sounds like very good news. Compared with the very first version of the strategy, our Annual Return is up to 4%, which is an increase of 400% from the initial 1%. The original Sharpe Ratio was 0.07, and now it is 0.38, a whooping increase of over 500%. It appears that the smoothing of the price curve and the stop loss are doing a great job on the AAPL as they did on MSFT. Now let’s explore what happens when we run it on the SPY.
Equity curve of the strategy on SPY
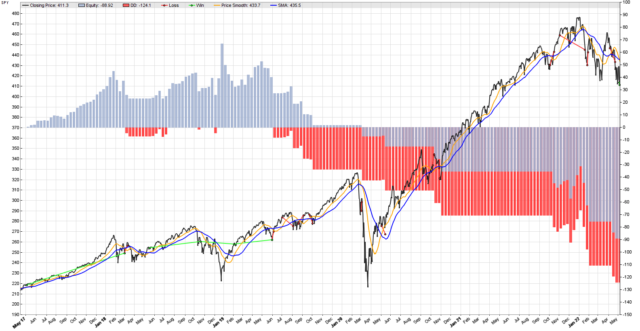
Oops! Things do not look good at all. It appears that we are losing money, although in the beginning we did make some profits. Something clearly changed in June 2019. Until that point everything was working as expected, and then the strategy stopped working. This warrants some further exploration, because algorithmic trading strategies always do that. They do work, until they stop working. And we need to be prepared for that. But this topic is beyond the scope of this post.
Zorro Trader performance strategy report
Test WithStopLoss SPY, Zorro 2.444

Simulated account   AssetsFix
Bar period          24 hours (avg 2087 min)
Total processed     1953 bars
Test period         2017-04-28..2022-05-06 (1265 bars)
Lookback period     80 bars (23 weeks)
Simulation mode     Realistic (slippage 5.0 sec)
Avg bar             357.1 pips range
Spread              10.0 pips (roll 0.00/0.00)
Commission          0.02
Contracts per lot   1.0

Gross win/loss      45.09$-132$, -8645.2p, lr -97.84$
Average profit      -17.22$/year, -1.43$/month, -0.0662$/day
Max drawdown        -124$ -143.6% (MAE -156$ -180.2%)
Total down time     67% (TAE 43%)
Max down time       213 weeks from Jun 2019
Max open margin     459$
Max open risk       13.89$
Trade volume        5759$ (1147$/year)
Transaction costs   -1.80$ spr, 0.57$ slp, 0$ rol, -0.36$ com
Capital required    555$

Number of trades    18 (4/year)
Percent winning     27.8%
Max win/loss        30.43$ / -14.08$
Avg trade profit    -4.80$ -480.3p (+901.7p / -1011.8p)
Avg trade slippage  0.0315$ 3.1p (+20.4p / -3.5p)
Avg trade bars      33 (+94 / -10)
Max trade bars      208 (60 weeks)
Time in market      48%
Max open trades     1
Max loss streak     12 (uncorrelated 11)

Annual return       -3%
Profit factor       0.34 (PRR 0.15)
Sharpe ratio        -0.61 (Sortino -0.55)
Kelly criterion     -11.73
Annualized StdDev   5.22%
R2 coefficient      0.000
Ulcer index         100.0%

Year Jan Feb Mar Apr May Jun Jul Aug Sep Oct Nov Dec Total
2017                   0   0   1   0   1   1   1   1    +5
2018   3  -2  -2   0  -0   0   2   2   0  -2  -1   4    +4
2019  -3   1   1   2  -3  -1   0  -2  -1  -1   0   0    -9
2020   0   0  -2   0  -1   0   0   0   0  -4   0   0    -7
2021   0   0   0   0   0   0   0   0   0  -2  -1   4    +0
2022  -7   0   0  -2   0                                -9

Portfolio analysis  OptF  ProF  Win/Loss   Wgt%

SPY                 .000  0.34    5/13    100.0
SPY:L               .000  0.64    3/6      26.1
SPY:S               .000  0.07    2/7      73.9
These results do not look good at all. We are losing, on average, 3% per year. The Sharpe Ratio is negative, which is terrible. However, these are both calculated as averages, and the equity curve of the strategy shows us a very important thing: something changed in June 2019, and the strategy started to make losses. Maybe the moving average formation periods were appropriate until June 2019, and inappropriate after that? Or maybe the stop loss became to tight for the later market regime, or too loose? Or all of the above?
Answering these questions is crucial for any successful algorithmic trading operation, as any systematic trading strategy, on any asset will eventually stop working. And at that time we will need to know if we need to adjust it, or to discard it. Learn more in our video courses in the members area.
by Algo Mike
Experienced algorithmic and quantitative trading professional.